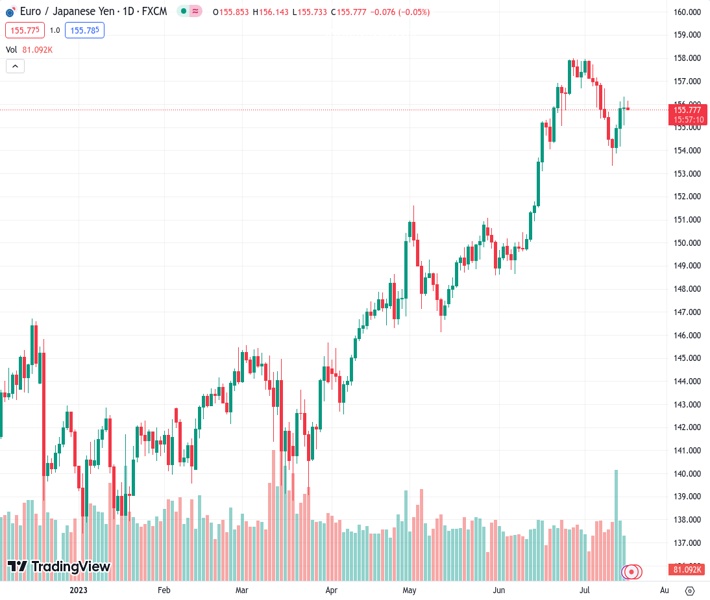
After initially rebounding from its lowest point of the day, the EURJPY currency pair at 155.804 has lost momentum and is now declining. This comes after reaching a one-week high the day before. According to the analysis by @nehcap, it is anticipated that there will be further downward movement.
…
This is a premium post.
[s2If !current_user_can(access_s2member_level4)]Please register for FREE REGISTER to read full post below containing analysis. In case of any error or you think you are not able to read the full post below, please email us at support#nehcap.com [lwa][/s2If] [s2If current_user_can(access_s2member_level1)]
- EUR/JPY fades bounce off intraday low after reversing from one-week high the previous day.
The pair currently trades last at 155.804.
The previous day high was 156.34 while the previous day low was 155.1. The daily 38.2% Fib levels comes at 155.57, expected to provide support. Similarly, the daily 61.8% fib level is at 155.87, expected to provide resistance.
EUR/JPY struggles around 155.80 heading into Tuesday’s European session, fading the bounce off the intraday low after reversing from a one-week high the previous day.
The cross-currency pair’s previous rebound from the intraday low appears to have limited acceptance as the 21-DMA and Monday’s bearish Doji candlestick on the daily formation prod the buyers.
Adding strength to the downside bias are the bearish MACD signals and a steady RSI (14) line.
With this, the EUR/JPY prices are likely to remain below the 156.00 round figure and can drop towards the latest trough surrounding 153.40 marked the last week.
However, an upward-sloping support line from early April, close to 152.85 by the press time, appears a tough nut to crack for the pair sellers, a break of which will drag the quote towards May’s peak of around 151.60.
On the contrary, a daily closing beyond the 21-DMA hurdle of around 156.30 isn’t a sure signal for the EUR/JPY rally as a three-week-long horizontal resistance area surrounding 156.70-90, quickly followed by the 157.00 round figure, will challenge the bulls before giving them control.
In that case, the yearly high marked in June around 158.00 and the 160.00 round figure will be in the spotlight.
Trend: Downside expected
Technical Levels: Supports and Resistances
EURJPY currently trading at 155.87 at the time of writing. Pair opened at 155.83 and is trading with a change of 0.03% % .
| Overview | Overview.1 | |
|---|---|---|
| 0 | Today last price | 155.87 |
| 1 | Today Daily Change | 0.04 |
| 2 | Today Daily Change % | 0.03% |
| 3 | Today daily open | 155.83 |
The pair is trading below its 20 Daily moving average @ 156.31, above its 50 Daily moving average @ 152.48 , above its 100 Daily moving average @ 148.83 and above its 200 Daily moving average @ 145.99
| Trends | Trends.1 | |
|---|---|---|
| 0 | Daily SMA20 | 156.31 |
| 1 | Daily SMA50 | 152.48 |
| 2 | Daily SMA100 | 148.83 |
| 3 | Daily SMA200 | 145.99 |
The previous day high was 156.34 while the previous day low was 155.1. The daily 38.2% Fib levels comes at 155.57, expected to provide support. Similarly, the daily 61.8% fib level is at 155.87, expected to provide resistance.
Note the levels of interest below:
- Pivot support is noted at 155.17, 154.52, 153.93
- Pivot resistance is noted at 156.42, 157.0, 157.66
| Levels | Levels.1 |
|---|---|
| Previous Daily High | 156.34 |
| Previous Daily Low | 155.10 |
| Previous Weekly High | 156.67 |
| Previous Weekly Low | 153.43 |
| Previous Monthly High | 158.00 |
| Previous Monthly Low | 148.62 |
| Daily Fibonacci 38.2% | 155.57 |
| Daily Fibonacci 61.8% | 155.87 |
| Daily Pivot Point S1 | 155.17 |
| Daily Pivot Point S2 | 154.52 |
| Daily Pivot Point S3 | 153.93 |
| Daily Pivot Point R1 | 156.42 |
| Daily Pivot Point R2 | 157.00 |
| Daily Pivot Point R3 | 157.66 |
[/s2If]
Download Nehcap EAWe have two EAs that are operational on our LIVE accounts.
- EA-FIX: Check out the details here. Download EA-FIX . EA-FIX is a non-grid HFT scalper.
- EA-GROWTH: High quality low dd EA using trend grids. Download EA_GROWTHJoin Our Telegram Group


