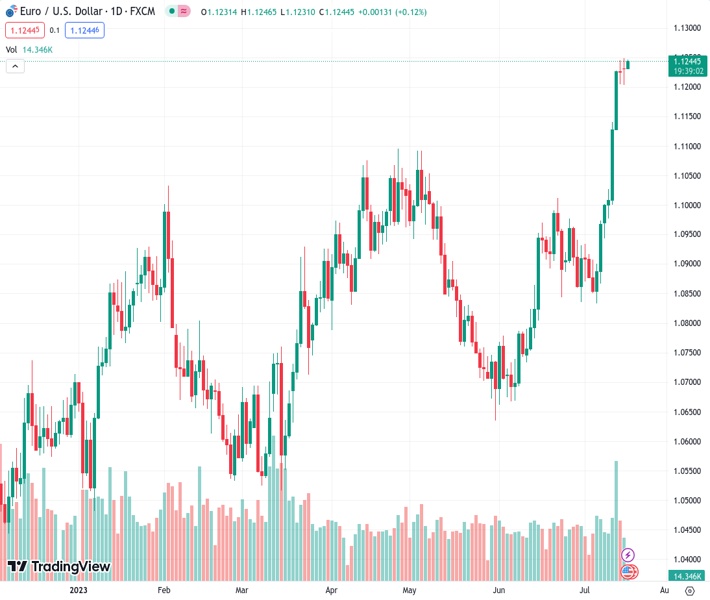
The EURUSD currency pair, currently trading at 1.12446, has slightly increased in value within a narrow trading range near its 17-month high. According to market analyst @nehcap, there is anticipation for the currency pair to continue advancing.
…
This is a premium post.
[s2If !current_user_can(access_s2member_level4)]Please register for FREE REGISTER to read full post below containing analysis. In case of any error or you think you are not able to read the full post below, please email us at support#nehcap.com [lwa][/s2If] [s2If current_user_can(access_s2member_level1)]
- EUR/USD edges higher within immediate trading range surrounding 17-month high.
The pair currently trades last at 1.12446.
The previous day high was 1.1249 while the previous day low was 1.1203. The daily 38.2% Fib levels comes at 1.1231, expected to provide support. Similarly, the daily 61.8% fib level is at 1.1221, expected to provide support.
EUR/USD remains on the front foot within a three-day-old 50-pip trading range above 1.1200, poking the upper limit surrounding 1.1250 during the mid-Asian session on Tuesday.
In doing so, the Euro pair cheers broad US Dollar weakness while also justifying hawkish commentary from the European Central Bank (ECB) Officials during a sluggish session ahead of the key US Retail Sales for June.
Also read: EUR/USD prods 1.1250 hurdle on hawkish ECB talks ahead of US Retail Sales
That said, the major currency pair’s successful trading above the 50 and 100 SMAs, as well as beyond a one-week-old rising support line, joins the upbeat RSI (14) line, not overbought, to keep the EUR/USD buyers hopeful of crossing the 1.1250 hurdle.
However, multiple levels marked in late 2021 and early 2022 challenged the Euro bulls near 1.1280 before directing them to the previous yearly high of around 1.1500.
Meanwhile, the 50-SMA and the stated trading range’s lower limit, respectively near 1.1230 and 1.1200, challenge intraday EUR/USD bears.
Following that, a convergence of the 100-SMA and an upward-sloping support line from July 06, close to 1.1175, appears as the key support to break for the EUR/USD sellers before taking control.
Trend: Further upside expected
Technical Levels: Supports and Resistances
EURUSD currently trading at 1.1242 at the time of writing. Pair opened at 1.1235 and is trading with a change of 0.06% % .
| Overview | Overview.1 | |
|---|---|---|
| 0 | Today last price | 1.1242 |
| 1 | Today Daily Change | 0.0007 |
| 2 | Today Daily Change % | 0.06% |
| 3 | Today daily open | 1.1235 |
The pair remains strongly bullish on the daily timeframe. It trades above its 20 SMA @ 1.0982, 50 SMA 1.0874, 100 SMA @ 1.086 and 200 SMA @ 1.066.
| Trends | Trends.1 | |
|---|---|---|
| 0 | Daily SMA20 | 1.0982 |
| 1 | Daily SMA50 | 1.0874 |
| 2 | Daily SMA100 | 1.0860 |
| 3 | Daily SMA200 | 1.0660 |
The previous day high was 1.1249 while the previous day low was 1.1203. The daily 38.2% Fib levels comes at 1.1231, expected to provide support. Similarly, the daily 61.8% fib level is at 1.1221, expected to provide support.
Note the levels of interest below:
- Pivot support is noted at 1.1209, 1.1184, 1.1164
- Pivot resistance is noted at 1.1255, 1.1275, 1.13
| Levels | Levels.1 |
|---|---|
| Previous Daily High | 1.1249 |
| Previous Daily Low | 1.1203 |
| Previous Weekly High | 1.1245 |
| Previous Weekly Low | 1.0944 |
| Previous Monthly High | 1.1012 |
| Previous Monthly Low | 1.0662 |
| Daily Fibonacci 38.2% | 1.1231 |
| Daily Fibonacci 61.8% | 1.1221 |
| Daily Pivot Point S1 | 1.1209 |
| Daily Pivot Point S2 | 1.1184 |
| Daily Pivot Point S3 | 1.1164 |
| Daily Pivot Point R1 | 1.1255 |
| Daily Pivot Point R2 | 1.1275 |
| Daily Pivot Point R3 | 1.1300 |
[/s2If]
Download Nehcap EAWe have two EAs that are operational on our LIVE accounts.
- EA-FIX: Check out the details here. Download EA-FIX . EA-FIX is a non-grid HFT scalper.
- EA-GROWTH: High quality low dd EA using trend grids. Download EA_GROWTHJoin Our Telegram Group


