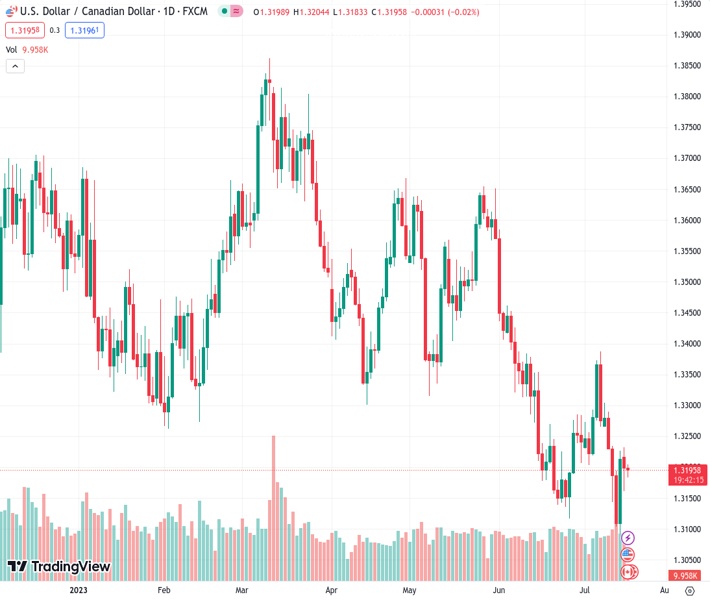
During the Asian session on Tuesday, the USDCAD exchange rate of 1.31988 stayed within a limited range for trading.
…
This is a premium post.
[s2If !current_user_can(access_s2member_level4)]Please register for FREE REGISTER to read full post below containing analysis. In case of any error or you think you are not able to read the full post below, please email us at support#nehcap.com [lwa][/s2If] [s2If current_user_can(access_s2member_level1)]
- USD/CAD remains confined in a narrow trading band through the Asian session on Tuesday.
The pair currently trades last at 1.31988.
The previous day high was 1.3232 while the previous day low was 1.3161. The daily 38.2% Fib levels comes at 1.3188, expected to provide support. Similarly, the daily 61.8% fib level is at 1.3205, expected to provide resistance.
The USD/CAD pair struggles to gain any meaningful traction and oscillates in a 15-20 pips narrow trading band, around the 1.3200 mark through the Asian session on Tuesday.
Following the recent pullback from a nearly three-month high witnessed over the past two days, Crude Oil prices regain some positive traction and underpin the commodity-linked Loonie. The US Dollar (USD), on the other hand, remains well within the striking distance of its lowest level since April 2022 in the wake of rising bets for a less hawkish Federal Reserve (Fed). This, in turn, is seen as a key factor acting as a headwind for the USD/CAD pair.
It is worth recalling that the markets have been pricing out the possibility of any additional rate hike for the rest of the year by the US central bank after the highly-anticipated 25 bps lift-off in July. The expectations were fueled by the incoming US macro data, which pointed to signs of cooling labor market and a further moderation in consumer prices. This had led to the recent decline in the US Treasury bond yields and keeps the USD bulls on the defensive.
Apart from this, a positive turnaround in the global risk sentiment – as depicted by the overnight rally in the US equity markets – is seen as another factor weighing on the safe-haven Greenback. Market participants, however, argue that the fall in the USD has been too fast and too far. Apart from this, expectations that the Fed might stick to its forecast for a 50 bps rate hike by the end of this year hold back traders from placing fresh bearish bets around the USD.
This, along with worries that a global economic downturn will dent fuel demand, should keep a lid on any meaningful rise in Crude Oil prices and help limit the downside for the USD/CAD pair. Meanwhile, the fundamental backdrop makes it prudent to wait for strong follow-through buying before confirming that spot prices have formed a near-term bottom and positioning for an extension of the recent recovery from sub-1.3100 levels, or the YTD low touched last Friday.
Traders might also refrain from placing aggressive bets and prefer to move to the sidelines ahead of the release of the Canadian consumer inflation figures, due later during the early North American session. Traders will further take cues from the US monthly Retail Sales figures. This, along with the US bond yields and the broader risk sentiment, could drive the USD demand. Apart from this, Oil price dynamics should provide some impetus to the USD/CAD pair.
Technical Levels: Supports and Resistances
USDCAD currently trading at 1.3198 at the time of writing. Pair opened at 1.3199 and is trading with a change of -0.01 % .
| Overview | Overview.1 | |
|---|---|---|
| 0 | Today last price | 1.3198 |
| 1 | Today Daily Change | -0.0001 |
| 2 | Today Daily Change % | -0.0100 |
| 3 | Today daily open | 1.3199 |
The pair remains strongly bearish on the daily time frame. It trades below the 20 SMA @ 1.3223, 50 SMA 1.3355, 100 SMA @ 1.3468 and 200 SMA @ 1.3489.
| Trends | Trends.1 | |
|---|---|---|
| 0 | Daily SMA20 | 1.3223 |
| 1 | Daily SMA50 | 1.3355 |
| 2 | Daily SMA100 | 1.3468 |
| 3 | Daily SMA200 | 1.3489 |
The previous day high was 1.3232 while the previous day low was 1.3161. The daily 38.2% Fib levels comes at 1.3188, expected to provide support. Similarly, the daily 61.8% fib level is at 1.3205, expected to provide resistance.
Note the levels of interest below:
- Pivot support is noted at 1.3163, 1.3126, 1.3091
- Pivot resistance is noted at 1.3234, 1.3269, 1.3305
| Levels | Levels.1 |
|---|---|
| Previous Daily High | 1.3232 |
| Previous Daily Low | 1.3161 |
| Previous Weekly High | 1.3304 |
| Previous Weekly Low | 1.3093 |
| Previous Monthly High | 1.3585 |
| Previous Monthly Low | 1.3117 |
| Daily Fibonacci 38.2% | 1.3188 |
| Daily Fibonacci 61.8% | 1.3205 |
| Daily Pivot Point S1 | 1.3163 |
| Daily Pivot Point S2 | 1.3126 |
| Daily Pivot Point S3 | 1.3091 |
| Daily Pivot Point R1 | 1.3234 |
| Daily Pivot Point R2 | 1.3269 |
| Daily Pivot Point R3 | 1.3305 |
[/s2If]
Download Nehcap EAWe have two EAs that are operational on our LIVE accounts.
- EA-FIX: Check out the details here. Download EA-FIX . EA-FIX is a non-grid HFT scalper.
- EA-GROWTH: High quality low dd EA using trend grids. Download EA_GROWTHJoin Our Telegram Group


