The USDJPY currency pair increases slightly on Tuesday, but there is a lack of sustained buying or strong bullish belief.
…
This is a premium post.
[s2If !current_user_can(access_s2member_level4)]Please register for FREE REGISTER to read full post below containing analysis. In case of any error or you think you are not able to read the full post below, please email us at support#nehcap.com [lwa][/s2If] [s2If current_user_can(access_s2member_level1)]
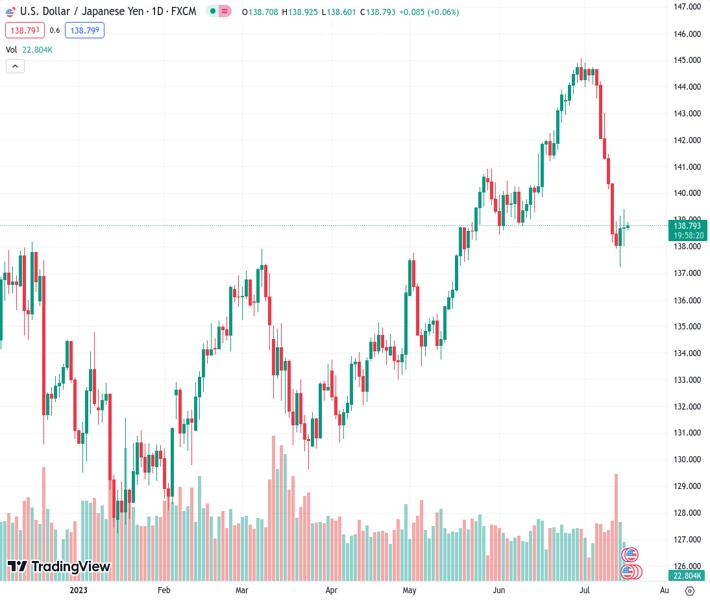
- USD/JPY edges higher on Tuesday, albeit lacks any follow-through buying or bullish conviction.
The pair currently trades last at 138.824.
The previous day high was 139.41 while the previous day low was 138.0. The daily 38.2% Fib levels comes at 138.54, expected to provide support. Similarly, the daily 61.8% fib level is at 138.87, expected to provide resistance.
The USD/JPY pair attracts some buying during the Asian session on Tuesday and steadily climbs back closer to the 139.00 mark, albeit lacks follow-through and remains confined well within the previous day’s broader trading range.
A turnaround in the global risk sentiment – as depicted by the overnight rally in the US equity markets – undermines the safe-haven Japanese Yen (JPY) and acts as a tailwind for the USD/JPY pair. The upside, however, remains capped in the wake of the underlying bearish sentiment surrounding the US Dollar (USD), which continues to be weighed down by firming expectations that the Federal Reserve (Fed) will soften its hawkish stance.
Investors now seem convinced that the US central bank is nearing the end of its policy tightening cycle and will keep interest rates steady for the rest of the year following the anticipated 25 bps lift-off in July. The bets were reaffirmed by the incoming US macro data, which pointed to a further moderation in consumer inflation, which led to the recent decline in the US Treasury bond yields and keeps the USD bulls on the defensive.
The JPY, on the other hand, continues to draw some support from speculations that the Bank of Japan (BoJ) could adjust its Yield Curve Control (YCC) policy as soon as this month. In fact, Japanese media reported that the BoJ is likely to raise its FY2023 inflation forecast, which has exceeded the 2% goal for more than a year and should put pressure on the central bank to start unwinding its ultra-loose monetary policy settings.
Apart from this, worries about a global economic downturn, fueled by weaker Chinese GDP print on Monday – should limit losses for the safe-haven JPY and contribute to capping gains for the USD/JPY pair. This makes it prudent to wait for strong follow-through buying before confirming that spot prices have formed a near-term bottom and positioning for any meaningful recovery from a two-month low touched last Friday.
Market participants now look forward to the US economic docket, featuring the release of monthly Retail Sales and Industrial Production figures later during the early North American session. This, along with the US bond yields, might influence the USD price dynamics and provide some impetus to the USD/JPY pair. Apart from this, the broader risk setniment should contribute to producing short-term opportunities.
Technical Levels: Supports and Resistances
USDJPY currently trading at 138.85 at the time of writing. Pair opened at 138.72 and is trading with a change of 0.09 % .
| Overview | Overview.1 | |
|---|---|---|
| 0 | Today last price | 138.85 |
| 1 | Today Daily Change | 0.13 |
| 2 | Today Daily Change % | 0.09 |
| 3 | Today daily open | 138.72 |
The pair is trading below its 20 Daily moving average @ 142.35, below its 50 Daily moving average @ 140.22 , above its 100 Daily moving average @ 137.04 and above its 200 Daily moving average @ 137.05
| Trends | Trends.1 | |
|---|---|---|
| 0 | Daily SMA20 | 142.35 |
| 1 | Daily SMA50 | 140.22 |
| 2 | Daily SMA100 | 137.04 |
| 3 | Daily SMA200 | 137.05 |
The previous day high was 139.41 while the previous day low was 138.0. The daily 38.2% Fib levels comes at 138.54, expected to provide support. Similarly, the daily 61.8% fib level is at 138.87, expected to provide resistance.
Note the levels of interest below:
- Pivot support is noted at 138.0, 137.29, 136.59
- Pivot resistance is noted at 139.42, 140.12, 140.83
| Levels | Levels.1 |
|---|---|
| Previous Daily High | 139.41 |
| Previous Daily Low | 138.00 |
| Previous Weekly High | 143.00 |
| Previous Weekly Low | 137.24 |
| Previous Monthly High | 145.07 |
| Previous Monthly Low | 138.43 |
| Daily Fibonacci 38.2% | 138.54 |
| Daily Fibonacci 61.8% | 138.87 |
| Daily Pivot Point S1 | 138.00 |
| Daily Pivot Point S2 | 137.29 |
| Daily Pivot Point S3 | 136.59 |
| Daily Pivot Point R1 | 139.42 |
| Daily Pivot Point R2 | 140.12 |
| Daily Pivot Point R3 | 140.83 |
[/s2If]
Download Nehcap EAWe have two EAs that are operational on our LIVE accounts.
- EA-FIX: Check out the details here. Download EA-FIX . EA-FIX is a non-grid HFT scalper.
- EA-GROWTH: High quality low dd EA using trend grids. Download EA_GROWTHJoin Our Telegram Group


