The USDCHF pair begins trading without much change at a rate of 0.86034, with technical indicators indicating the potential for an upward correction.
…
This is a premium post.
[s2If !current_user_can(access_s2member_level4)]Please register for FREE REGISTER to read full post below containing analysis. In case of any error or you think you are not able to read the full post below, please email us at support#nehcap.com [lwa][/s2If] [s2If current_user_can(access_s2member_level1)]
- USD/CHF starts flat, and technical indicators suggest a possible upward correction.
The pair currently trades last at 0.86034.
The previous day high was 0.8632 while the previous day low was 0.8566. The daily 38.2% Fib levels comes at 0.8607, expected to provide resistance. Similarly, the daily 61.8% fib level is at 0.8591, expected to provide support.
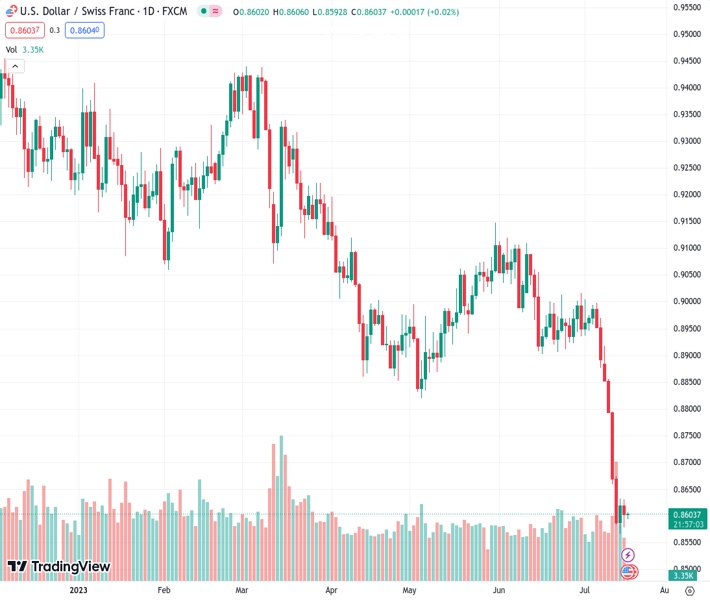
USD/CHF begins the Asian session almost flat, following Monday’s losses of 0.20% after printing a year-to-date (YTD) low of 0.8566 last Friday. Technical indicators turned flat alongside an overextended downtrend, which could pave the way for an upward correction. At the time of writing, the USD/CHF exchanges hands at 0.8605, up 0.03%.
From a daily chart perspective, the USD/CHF downtrend remains intact, with sellers eyeing a drop below the YTD low, exposing the pair to a new eight-year low below 0.8300. The Relative Strength Index (RSI) is in bearish territory but turned flat after reaching an overbought extreme level at 21.42, while the three-day Rate of Change (RoC) began to turn neutral, portraying that selling pressure faded, opening the door for a correction.
In that event, the USD/CHF first resistance would be the 0.8700 psychological level, followed by key resistance Fibonacci (Fibo) levels, with 38.2% and 50% Fibo, each at 0.8730 and 0.8780. Once those levels are cleared, the 0.8800 figure would be up next.
On the downside, the USD/CHF first support would be 0.8600, followed by the YTD low of 0.8566 and the 0.8500 psychological level.
Technical Levels: Supports and Resistances
USDCHF currently trading at 0.8603 at the time of writing. Pair opened at 0.8619 and is trading with a change of -0.19 % .
| Overview | Overview.1 | |
|---|---|---|
| 0 | Today last price | 0.8603 |
| 1 | Today Daily Change | -0.0016 |
| 2 | Today Daily Change % | -0.1900 |
| 3 | Today daily open | 0.8619 |
The pair remains strongly bearish on the daily time frame. It trades below the 20 SMA @ 0.8895, 50 SMA 0.8965, 100 SMA @ 0.904 and 200 SMA @ 0.9253.
| Trends | Trends.1 | |
|---|---|---|
| 0 | Daily SMA20 | 0.8895 |
| 1 | Daily SMA50 | 0.8965 |
| 2 | Daily SMA100 | 0.9040 |
| 3 | Daily SMA200 | 0.9253 |
The previous day high was 0.8632 while the previous day low was 0.8566. The daily 38.2% Fib levels comes at 0.8607, expected to provide resistance. Similarly, the daily 61.8% fib level is at 0.8591, expected to provide support.
Note the levels of interest below:
- Pivot support is noted at 0.858, 0.854, 0.8515
- Pivot resistance is noted at 0.8645, 0.8671, 0.8711
| Levels | Levels.1 |
|---|---|
| Previous Daily High | 0.8632 |
| Previous Daily Low | 0.8566 |
| Previous Weekly High | 0.8918 |
| Previous Weekly Low | 0.8566 |
| Previous Monthly High | 0.9120 |
| Previous Monthly Low | 0.8902 |
| Daily Fibonacci 38.2% | 0.8607 |
| Daily Fibonacci 61.8% | 0.8591 |
| Daily Pivot Point S1 | 0.8580 |
| Daily Pivot Point S2 | 0.8540 |
| Daily Pivot Point S3 | 0.8515 |
| Daily Pivot Point R1 | 0.8645 |
| Daily Pivot Point R2 | 0.8671 |
| Daily Pivot Point R3 | 0.8711 |
[/s2If]
Download Nehcap EAWe have two EAs that are operational on our LIVE accounts.
- EA-FIX: Check out the details here. Download EA-FIX . EA-FIX is a non-grid HFT scalper.
- EA-GROWTH: High quality low dd EA using trend grids. Download EA_GROWTHJoin Our Telegram Group


