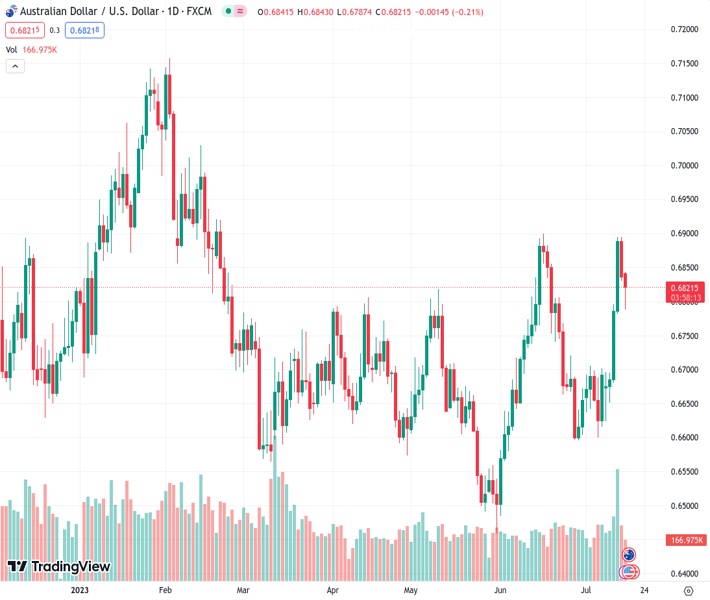
The AUDUSD currency pair, which was traded at a rate of 0.68228, experienced a decrease of 0.20% as a result of negative Chinese GDP and Retail Sales data. The US dollar recovered after experiencing its worst week since November 2022.
…
This is a premium post.
[s2If !current_user_can(access_s2member_level4)]Please register for FREE REGISTER to read full post below containing analysis. In case of any error or you think you are not able to read the full post below, please email us at support#nehcap.com [lwa][/s2If] [s2If current_user_can(access_s2member_level1)]
- AUD/USD registers 0.20% loss, buffeted by weak Chinese GDP and Retail Sales data; USD rebounds after its worst week since November 2022.
The pair currently trades last at 0.68228.
The previous day high was 0.6895 while the previous day low was 0.6831. The daily 38.2% Fib levels comes at 0.6855, expected to provide resistance. Similarly, the daily 61.8% fib level is at 0.687, expected to provide resistance.
AUD/USD dropped from around the 0.6850 area amid a possible global economic outlook, as soft economic data from China weighed on the Australian Dollar (USD). That bolstered the US Dollar (USD), which posted its worst week since November 2022. At the time of writing, the AUD/USD is trading at 0.6822, with losses of 0.20%.
US equities shrugged off mixed data from China that painted a gloomy economic outlook after the Gross Domestic Product (GDP) in China expanded by 0.8% QoQ, beneath the first quarter (Q1) by 2.2%, while on an annual basis, the economy grew at a 6.3% pace, below 7.1% forecasts, above Q1’s 4.5%. In the meantime, Industrial Production gathered pace, while Retail Sales decelerated sharply from 12.7% in May to 3.1% in June.
A light US economic docket keeps AUD/USD traders focused on the release of Retail Sales on Tuesday, which are expected to rise by 0.5%, above the prior month’s 0.3%. The latest US Consumer Sentiment report spurred speculations about June’s retail sales report, as consumers remain optimistic about the economy. On the same day, the US Federal Reserve (Fed) will unveil US Industrial production, estimated at 0% MoM, below May 0.2% expansion.
On the Australian front, news emerged the Reserve Bank of Australia (RBA) Governor Philip Lowe would not continue as the head of the bank and would be substituted by the current Deputy Governor Michele Bullock. Aside from this, the RBA would unveil its latest monetary policy meeting minutes.
The AUD/USD rally was capped shy of breaching the 0.6900 figure, exacerbating a downward correction, past the May 10 daily high of 0.6818, with the AUD/USD extending its fall toward a daily low of 0.6787 before trimming some of its losses. A daily close above 0.6818 could pave the way for AUD/USD to retest 0.6900. A decisive break will expose the 0.7000 figure, but firstly, the AUD/USD buyers must regain the February 21 high at 0.6919. Conversely, the AUD/USD first support would be 0.6800, followed by the current week’s low of 0.6787.
Technical Levels: Supports and Resistances
AUDUSD currently trading at 0.6821 at the time of writing. Pair opened at 0.6839 and is trading with a change of -0.26 % .
| Overview | Overview.1 | |
|---|---|---|
| 0 | Today last price | 0.6821 |
| 1 | Today Daily Change | -0.0018 |
| 2 | Today Daily Change % | -0.2600 |
| 3 | Today daily open | 0.6839 |
The pair remains strongly bullish on the daily timeframe. It trades above its 20 SMA @ 0.6716, 50 SMA 0.6686, 100 SMA @ 0.6685 and 200 SMA @ 0.6705.
| Trends | Trends.1 | |
|---|---|---|
| 0 | Daily SMA20 | 0.6716 |
| 1 | Daily SMA50 | 0.6686 |
| 2 | Daily SMA100 | 0.6685 |
| 3 | Daily SMA200 | 0.6705 |
The previous day high was 0.6895 while the previous day low was 0.6831. The daily 38.2% Fib levels comes at 0.6855, expected to provide resistance. Similarly, the daily 61.8% fib level is at 0.687, expected to provide resistance.
Note the levels of interest below:
- Pivot support is noted at 0.6815, 0.679, 0.675
- Pivot resistance is noted at 0.6879, 0.6919, 0.6943
| Levels | Levels.1 |
|---|---|
| Previous Daily High | 0.6895 |
| Previous Daily Low | 0.6831 |
| Previous Weekly High | 0.6895 |
| Previous Weekly Low | 0.6624 |
| Previous Monthly High | 0.6900 |
| Previous Monthly Low | 0.6484 |
| Daily Fibonacci 38.2% | 0.6855 |
| Daily Fibonacci 61.8% | 0.6870 |
| Daily Pivot Point S1 | 0.6815 |
| Daily Pivot Point S2 | 0.6790 |
| Daily Pivot Point S3 | 0.6750 |
| Daily Pivot Point R1 | 0.6879 |
| Daily Pivot Point R2 | 0.6919 |
| Daily Pivot Point R3 | 0.6943 |
[/s2If]
Download Nehcap EAWe have two EAs that are operational on our LIVE accounts.
- EA-FIX: Check out the details here. Download EA-FIX . EA-FIX is a non-grid HFT scalper.
- EA-GROWTH: High quality low dd EA using trend grids. Download EA_GROWTHJoin Our Telegram Group


