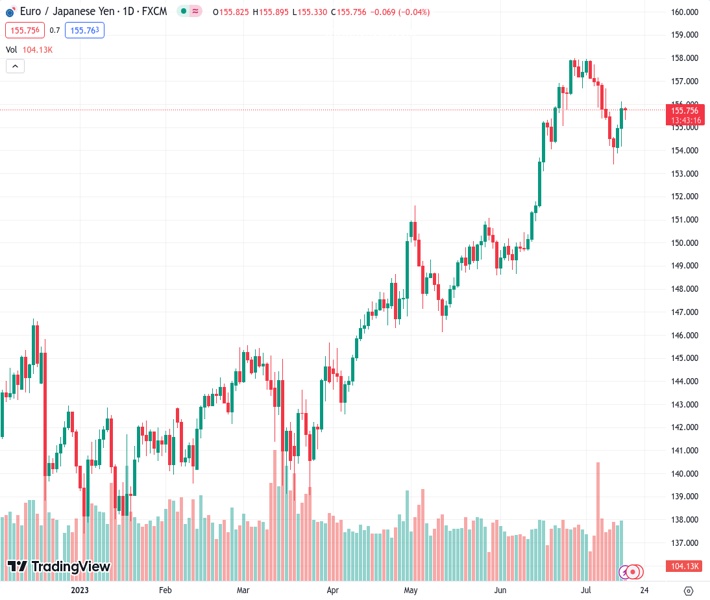
The EURJPY pair at the level of 155.770 is maintaining stability and consolidating within a small range throughout the day on Monday.
…
This is a premium post.
[s2If !current_user_can(access_s2member_level4)]Please register for FREE REGISTER to read full post below containing analysis. In case of any error or you think you are not able to read the full post below, please email us at support#nehcap.com [lwa][/s2If] [s2If current_user_can(access_s2member_level1)]
- EUR/JPY remains steady and consolidates in a narrow range on Monday.
The pair currently trades last at 155.770.
The previous day high was 156.14 while the previous day low was 154.17. The daily 38.2% Fib levels comes at 155.39, expected to provide support. Similarly, the daily 61.8% fib level is at 154.92, expected to provide support.
The EUR/JPY pair lacks any firm directional bias and oscillates in the 155.30-156.15 range early Monday. The cross currently trades near 155.50, down 0.19% on the day.
According to the four-hour chart, EUR/JPY holds above the 100- and 200-day Exponential Moving Averages (EMA), meaning the path of least resistance for the EUR/JPY appears to the upside.
That being said, any meaningful follow-through buying past 156.15 (High of July 14) will see a rally to 157.15 (High of July 6). Further north, the cross will challenge the next hurdle at 158.00, the intersection of the psychological round mark and a high of July 3.
On the flip side, EUR/JPY will meet initial support of 155.40 (100-hour EMA) en route to 154.20 (200-hour EMA). A decisive break below the latter would expose 153.40 (Low of July 12).
It’s worth noting that the Relative Strength Index (RSI) is located in the 40-60 zone, indicating a non-directional movement in the pair.
Technical Levels: Supports and Resistances
EURJPY currently trading at 155.54 at the time of writing. Pair opened at 155.85 and is trading with a change of -0.2 % .
| Overview | Overview.1 | |
|---|---|---|
| 0 | Today last price | 155.54 |
| 1 | Today Daily Change | -0.31 |
| 2 | Today Daily Change % | -0.20 |
| 3 | Today daily open | 155.85 |
The pair is trading below its 20 Daily moving average @ 156.28, above its 50 Daily moving average @ 152.34 , above its 100 Daily moving average @ 148.72 and above its 200 Daily moving average @ 145.92
| Trends | Trends.1 | |
|---|---|---|
| 0 | Daily SMA20 | 156.28 |
| 1 | Daily SMA50 | 152.34 |
| 2 | Daily SMA100 | 148.72 |
| 3 | Daily SMA200 | 145.92 |
The previous day high was 156.14 while the previous day low was 154.17. The daily 38.2% Fib levels comes at 155.39, expected to provide support. Similarly, the daily 61.8% fib level is at 154.92, expected to provide support.
Note the levels of interest below:
- Pivot support is noted at 154.63, 153.42, 152.67
- Pivot resistance is noted at 156.6, 157.35, 158.57
| Levels | Levels.1 |
|---|---|
| Previous Daily High | 156.14 |
| Previous Daily Low | 154.17 |
| Previous Weekly High | 156.67 |
| Previous Weekly Low | 153.43 |
| Previous Monthly High | 158.00 |
| Previous Monthly Low | 148.62 |
| Daily Fibonacci 38.2% | 155.39 |
| Daily Fibonacci 61.8% | 154.92 |
| Daily Pivot Point S1 | 154.63 |
| Daily Pivot Point S2 | 153.42 |
| Daily Pivot Point S3 | 152.67 |
| Daily Pivot Point R1 | 156.60 |
| Daily Pivot Point R2 | 157.35 |
| Daily Pivot Point R3 | 158.57 |
[/s2If]
Download Nehcap EAWe have two EAs that are operational on our LIVE accounts.
- EA-FIX: Check out the details here. Download EA-FIX . EA-FIX is a non-grid HFT scalper.
- EA-GROWTH: High quality low dd EA using trend grids. Download EA_GROWTHJoin Our Telegram Group


