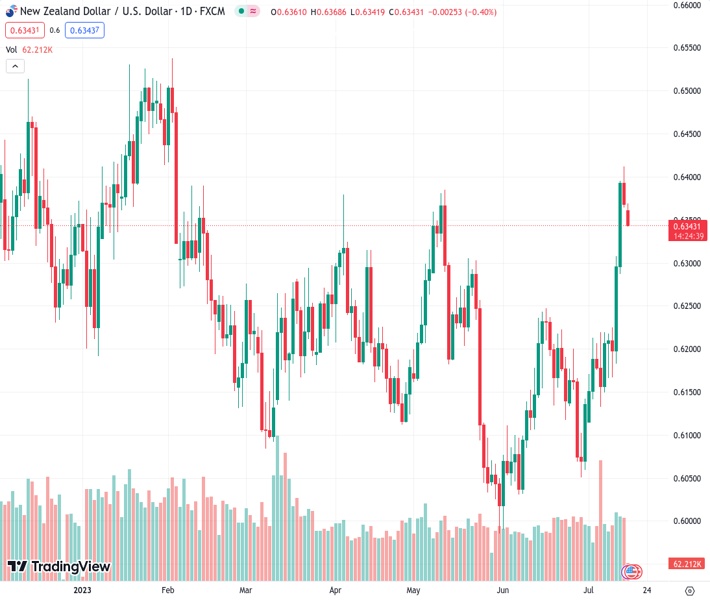
The New Zealand dollar to US dollar exchange rate at 0.63427 has decreased close to 0.6350, even though the US dollar index has been fluctuating.
…
This is a premium post.
[s2If !current_user_can(access_s2member_level4)]Please register for FREE REGISTER to read full post below containing analysis. In case of any error or you think you are not able to read the full post below, please email us at support#nehcap.com [lwa][/s2If] [s2If current_user_can(access_s2member_level1)]
- NZD/USD has dropped to near 0.6350 despite USD Index remaining choppy.
The pair currently trades last at 0.63427.
The previous day high was 0.6413 while the previous day low was 0.6364. The daily 38.2% Fib levels comes at 0.6383, expected to provide resistance. Similarly, the daily 61.8% fib level is at 0.6394, expected to provide resistance.
The NZD/USD pair has extended its correction to near 0.6350 in the early European session. The Kiwi asset has faced pressure after mixing China’s Gross Domestic Product (GDP) data. China’s quarterly GDP has expanded at a 0.8% pace higher than the estimates of 0.5% but extremely lower than the prior pace of 2.2%. While annualized GDP landed at 6.3%, lower than the consensus of 7.3% but higher than the former release of 4.5%.
Mixed GDP numbers have prompted the need for more loose policy from the People’s Bank of China (PBoC) as the economic recovery is not on track due to lower consumer spending and rising pain in real estate.
Apart from the GDP figures, annual Retail Sales have decelerated to 3.1% vs. the estimates of 3.2% and the former release of 12.7%. Contrary, annualized Industrial Production jumped to 4.4$ vs. the consensus of 2.7% and the prior figure of 3.5%. It is worth noting that New Zealand is one of the leading trading partners of China and bleak economic recovery in China impacts the New Zealand Dollar.
Going forward, the New Zealand Dollar would react to the second-quarter inflation data, which will release on Tuesday at 22:45 GMT. The quarterly Consumer Price Index (CPI) is seen softening to 0.9% vs. the former pace of 1.2%. Annualized CPI is expected to decelerate to 5.9% against the prior release of 6.7%.
Meanwhile, S&P500 futures have posted nominal losses in Asia, portraying a cautious market mood. The US Dollar Index (DXY) is demonstrating a non-directional performance below the psychological resistance of 100.00. The USD Index is making efforts to deliver a solid recovery after a significant sell-off. Consistently softening United States inflation and easing labor market conditions are the real triggers behind doomsday for the USD Index. The next trigger for the USD Index will be the monthly Retail Sales data for June, which will release on Tuesday.
Technical Levels: Supports and Resistances
NZDUSD currently trading at 0.6346 at the time of writing. Pair opened at 0.6369 and is trading with a change of -0.36 % .
| Overview | Overview.1 | |
|---|---|---|
| 0 | Today last price | 0.6346 |
| 1 | Today Daily Change | -0.0023 |
| 2 | Today Daily Change % | -0.3600 |
| 3 | Today daily open | 0.6369 |
The pair remains strongly bullish on the daily timeframe. It trades above its 20 SMA @ 0.619, 50 SMA 0.6175, 100 SMA @ 0.6193 and 200 SMA @ 0.619.
| Trends | Trends.1 | |
|---|---|---|
| 0 | Daily SMA20 | 0.6190 |
| 1 | Daily SMA50 | 0.6175 |
| 2 | Daily SMA100 | 0.6193 |
| 3 | Daily SMA200 | 0.6190 |
The previous day high was 0.6413 while the previous day low was 0.6364. The daily 38.2% Fib levels comes at 0.6383, expected to provide resistance. Similarly, the daily 61.8% fib level is at 0.6394, expected to provide resistance.
Note the levels of interest below:
- Pivot support is noted at 0.6351, 0.6333, 0.6302
- Pivot resistance is noted at 0.64, 0.6431, 0.6449
| Levels | Levels.1 |
|---|---|
| Previous Daily High | 0.6413 |
| Previous Daily Low | 0.6364 |
| Previous Weekly High | 0.6413 |
| Previous Weekly Low | 0.6166 |
| Previous Monthly High | 0.6250 |
| Previous Monthly Low | 0.5990 |
| Daily Fibonacci 38.2% | 0.6383 |
| Daily Fibonacci 61.8% | 0.6394 |
| Daily Pivot Point S1 | 0.6351 |
| Daily Pivot Point S2 | 0.6333 |
| Daily Pivot Point S3 | 0.6302 |
| Daily Pivot Point R1 | 0.6400 |
| Daily Pivot Point R2 | 0.6431 |
| Daily Pivot Point R3 | 0.6449 |
[/s2If]
Download Nehcap EAWe have two EAs that are operational on our LIVE accounts.
- EA-FIX: Check out the details here. Download EA-FIX . EA-FIX is a non-grid HFT scalper.
- EA-GROWTH: High quality low dd EA using trend grids. Download EA_GROWTHJoin Our Telegram Group


