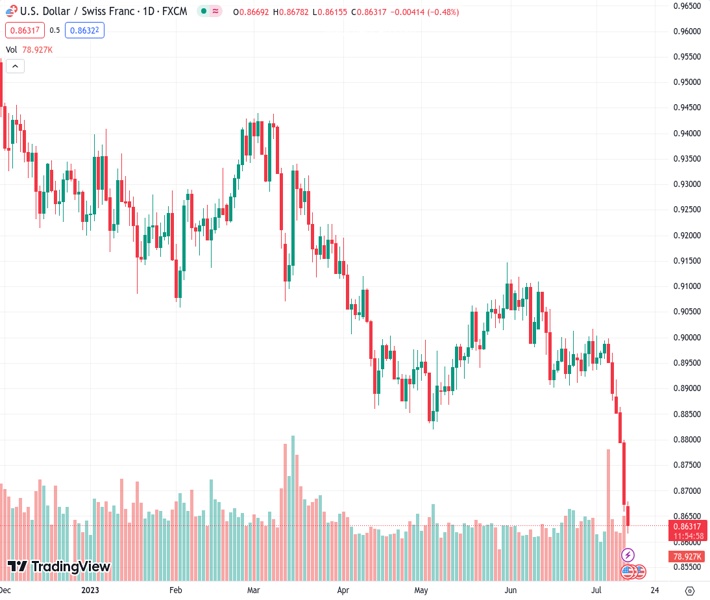
The pair USDCHF, currently trading at 0.86305, is experiencing a prolonged decline for the sixth consecutive day and reaches a new low not seen in several years.
…
This is a premium post.
[s2If !current_user_can(access_s2member_level4)]Please register for FREE REGISTER to read full post below containing analysis. In case of any error or you think you are not able to read the full post below, please email us at support#nehcap.com [lwa][/s2If] [s2If current_user_can(access_s2member_level1)]
- USD/CHF continues losing round for the sixth straight day and dives to a fresh multi-year low.
The pair currently trades last at 0.86305.
The previous day high was 0.88 while the previous day low was 0.8659. The daily 38.2% Fib levels comes at 0.8713, expected to provide resistance. Similarly, the daily 61.8% fib level is at 0.8746, expected to provide resistance.
The USD/CHF pair prolongs its downtrend for the sixth successive day on Thursday and drops to its lowest level since January 2015, around the 0.8620-0.8615 region during the early part of the European session.
The ongoing downfall is exclusively sponsored by the relentless selling around the US Dollar (USD), which sinks to a 15-month low in the wake of firming expectations that the Federal Reserve (Fed) will hike interest rates only one more time this year. The bets were lifted by softer US consumer inflation figures released on Wednesday, showing that the headline US CPI rose just 0.2% in June and the yearly rate slowed from 4% to 3% – marking the smallest rise since March 2021. Moreover, the monthly increase in core prices was the smallest since August 2021.
This comes on the back of signs that the US labor market is cooling and should allow the Fed to soften its hawkish stance, fueling speculations that the US central bank is close to ending its fastest monetary policy tightening cycle since the 1980s. This, in turn, lead to a further decline in the US Treasury bond yields, which is seen weighing on the Greenback and exerting heavy pressure on the USD/CHF pair. The steep decline, meanwhile, seems rather unaffected by the prevailing risk-on environment, which tends to undermine the safe-haven Swiss Franc (CHF).
With the latest leg down, spot prices have fallen nearly 400 pips from the 0.9000 psychological mark, or the monthly peak touched last week. This, along with the extremely oversold Relative Strength Index (RSI) on the daily chart, might prompt bearish traders to take some profits off the table and help limit any further losses for the USD/CHF pair, at least for the time being. Market participants now look to the US economic docket, featuring the Producer Price Index (PPI) and the usual Weekly Initial Jobless Claims for some meaningful impetus.
Technical Levels: Supports and Resistances
USDCHF currently trading at 0.8617 at the time of writing. Pair opened at 0.8674 and is trading with a change of -0.66 % .
| Overview | Overview.1 | |
|---|---|---|
| 0 | Today last price | 0.8617 |
| 1 | Today Daily Change | -0.0057 |
| 2 | Today Daily Change % | -0.6600 |
| 3 | Today daily open | 0.8674 |
The pair remains strongly bearish on the daily time frame. It trades below the 20 SMA @ 0.8927, 50 SMA 0.8976, 100 SMA @ 0.9056 and 200 SMA @ 0.9266.
| Trends | Trends.1 | |
|---|---|---|
| 0 | Daily SMA20 | 0.8927 |
| 1 | Daily SMA50 | 0.8976 |
| 2 | Daily SMA100 | 0.9056 |
| 3 | Daily SMA200 | 0.9266 |
The previous day high was 0.88 while the previous day low was 0.8659. The daily 38.2% Fib levels comes at 0.8713, expected to provide resistance. Similarly, the daily 61.8% fib level is at 0.8746, expected to provide resistance.
Note the levels of interest below:
- Pivot support is noted at 0.8622, 0.857, 0.8481
- Pivot resistance is noted at 0.8764, 0.8852, 0.8905
| Levels | Levels.1 |
|---|---|
| Previous Daily High | 0.8800 |
| Previous Daily Low | 0.8659 |
| Previous Weekly High | 0.9005 |
| Previous Weekly Low | 0.8876 |
| Previous Monthly High | 0.9120 |
| Previous Monthly Low | 0.8902 |
| Daily Fibonacci 38.2% | 0.8713 |
| Daily Fibonacci 61.8% | 0.8746 |
| Daily Pivot Point S1 | 0.8622 |
| Daily Pivot Point S2 | 0.8570 |
| Daily Pivot Point S3 | 0.8481 |
| Daily Pivot Point R1 | 0.8764 |
| Daily Pivot Point R2 | 0.8852 |
| Daily Pivot Point R3 | 0.8905 |
[/s2If]
Download Nehcap EAWe have two EAs that are operational on our LIVE accounts.
- EA-FIX: Check out the details here. Download EA-FIX . EA-FIX is a non-grid HFT scalper.
- EA-GROWTH: High quality low dd EA using trend grids. Download EA_GROWTHJoin Our Telegram Group
")


