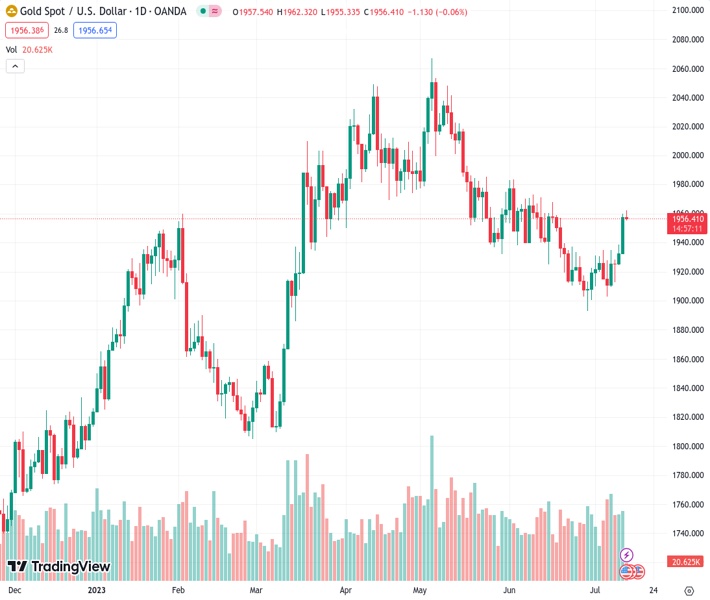
The price of gold, currently at $1,956.06, is anticipated to surpass the immediate barrier of $1,960.00 due to a significant decline in US inflation.
…
This is a premium post.
[s2If !current_user_can(access_s2member_level4)]Please register for FREE REGISTER to read full post below containing analysis. In case of any error or you think you are not able to read the full post below, please email us at support#nehcap.com [lwa][/s2If] [s2If current_user_can(access_s2member_level1)]
- Gold price is expected to cross the immediate resistance of $1,960.00 as US inflation has decelerated sharply.
The pair currently trades last at 1956.06.
The previous day high was 1959.73 while the previous day low was 1932.22. The daily 38.2% Fib levels comes at 1949.22, expected to provide support. Similarly, the daily 61.8% fib level is at 1942.73, expected to provide support.
Gold price (XAU/USD) has faced fragile barricades while attempting to surpass the immediate resistance of $1,960.00 in the late Asian session. The precious metal has is expected to resume its upside journey as inflationary pressures in the United States have softened dramatically and are sufficient to encourage the Federal Reserve (Fed) to go with only one interest rate hike by year-end.
S&P500 futures have posted significant gains overnight. US equities ended on a bullish note on Wednesday, portraying strength in the risk appetite theme. The US-500 stock basket could show some uncertain moves as the second-quarter result season will kick off sooner.
The US Dollar Index (DXY) has turned sideways around 100.50 after a five-day losing streak as the sheer softening of the United States Consumer Price Index (CPI) has trimmed fears of a potential recession. On Thursday, US Producer Price Index (PPI) data will be keenly watched.
About interest rate guidance, economists at Commerzbank cited that in the US, there are increasing signs that inflationary pressure is easing. In June, consumer prices rose by only 0.2% compared with the previous month. The core rate (which excludes energy and food), which is important as a measure of the underlying trend, was also only 0.2%, the smallest increase since February 2021. While the Fed is still likely to raise interest rates again at the end of the month, the data support our view that this should be the last hike.
Gold price has delivered a breakout of the Inverted Head and Shoulder chart pattern formed on a four-hour scale. A breakout of the aforementioned chart pattern has resulted in a bullish reversal. The neckline of the chart pattern was plotted around June 21 high at $1,940.00. The next stop for the Gold bulls is placed around May 19 high at $1,984.25.
The 20-period Exponential Moving Average (EMA) at $1,940.21 will continue to provide a cushion to the Gold bulls.
Meanwhile, the Relative Strength Index (RSI) (14) has confidently shifted into the bullish range of 60.00-80.00, which indicates that the bullish momentum has been triggered.
Technical Levels: Supports and Resistances
XAUUSD currently trading at 1957.14 at the time of writing. Pair opened at 1957.48 and is trading with a change of -0.02 % .
| Overview | Overview.1 | |
|---|---|---|
| 0 | Today last price | 1957.14 |
| 1 | Today Daily Change | -0.34 |
| 2 | Today Daily Change % | -0.02 |
| 3 | Today daily open | 1957.48 |
The pair is trading above its 20 Daily moving average @ 1927.75, below its 50 Daily moving average @ 1957.53 , above its 100 Daily moving average @ 1950.96 and above its 200 Daily moving average @ 1869.98
| Trends | Trends.1 | |
|---|---|---|
| 0 | Daily SMA20 | 1927.75 |
| 1 | Daily SMA50 | 1957.53 |
| 2 | Daily SMA100 | 1950.96 |
| 3 | Daily SMA200 | 1869.98 |
The previous day high was 1959.73 while the previous day low was 1932.22. The daily 38.2% Fib levels comes at 1949.22, expected to provide support. Similarly, the daily 61.8% fib level is at 1942.73, expected to provide support.
Note the levels of interest below:
- Pivot support is noted at 1939.89, 1922.3, 1912.38
- Pivot resistance is noted at 1967.4, 1977.32, 1994.91
| Levels | Levels.1 |
|---|---|
| Previous Daily High | 1959.73 |
| Previous Daily Low | 1932.22 |
| Previous Weekly High | 1935.09 |
| Previous Weekly Low | 1902.77 |
| Previous Monthly High | 1983.50 |
| Previous Monthly Low | 1893.01 |
| Daily Fibonacci 38.2% | 1949.22 |
| Daily Fibonacci 61.8% | 1942.73 |
| Daily Pivot Point S1 | 1939.89 |
| Daily Pivot Point S2 | 1922.30 |
| Daily Pivot Point S3 | 1912.38 |
| Daily Pivot Point R1 | 1967.40 |
| Daily Pivot Point R2 | 1977.32 |
| Daily Pivot Point R3 | 1994.91 |
[/s2If]
Download Nehcap EAWe have two EAs that are operational on our LIVE accounts.
- EA-FIX: Check out the details here. Download EA-FIX . EA-FIX is a non-grid HFT scalper.
- EA-GROWTH: High quality low dd EA using trend grids. Download EA_GROWTHJoin Our Telegram Group
")


