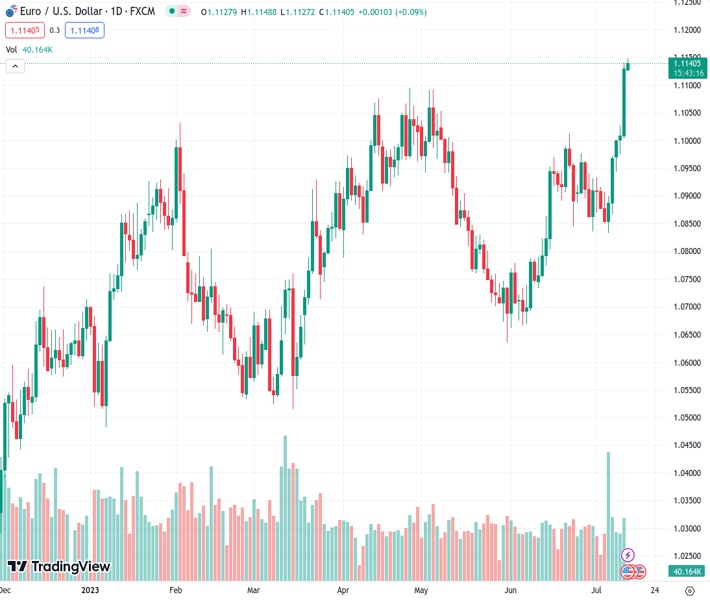
The EURUSD pair, trading at 1.11426, has shown impressive strength and climbed close to 1.1150, benefiting from a significant decrease in the USD Index.
…
This is a premium post.
[s2If !current_user_can(access_s2member_level4)]Please register for FREE REGISTER to read full post below containing analysis. In case of any error or you think you are not able to read the full post below, please email us at support#nehcap.com [lwa][/s2If] [s2If current_user_can(access_s2member_level1)]
- EUR/USD has demonstrated a stellar run to near 1.1150 amid an intense sell-off in the USD Index.
The pair currently trades last at 1.11426.
The previous day high was 1.114 while the previous day low was 1.1005. The daily 38.2% Fib levels comes at 1.1089, expected to provide support. Similarly, the daily 61.8% fib level is at 1.1057, expected to provide support.
The EUR/USD pair is consistently moving north with sheer momentum as soft United States Consumer Price Index (CPI) data drummed that only one interest rate hike option has left in the toolkit of the Federal Reserve (Fed) by year-end. The major currency pair has climbed to near 1.1150 as the US Dollar Index (DXY) is facing winter and the market mood is quite cheerful.
US monthly headline and core inflation registered a moderate pace of 0.2% in June along with a significant decline in annualized numbers due to falling prices of second-hand motor vehicles. The US Dollar Index (DXY) has shown a vertical fall to near 101.40 and is expected to continue its downside momentum.
Meanwhile, the European Central Bank (ECB) is expected to raise interest rates further to tame stubborn inflation. ECB President Christine Lagarde has already made clear that more interest rates are appropriate.
EUR/USD is gathering strength for delivering a breakout of the slightly rising channel formed on a daily scale. The upper portion of the aforementioned chart pattern is placed from February 03 high at 1.1033 while the lower portion is plotted from March 15 low at 1.0516. Potential resistance is placed from 14 January 2022 high at 1.1483.
Upward-sloping 20-period Exponential Moving Average (EMA) at 1.0947 indicates that the short-term trend is bullish.
The Relative Strength Index (RSI) (14) has jumped into the bullish range of 60.00-80.00, which indicates that the upside momentum has been activated.
For further upside, a decisive break above the round-level resistance of 1.1200 would expose the asset to 01 March 2022 high at 1.1233 followed by 25 February 2022 high at 1.1271.
In an alternate scenario, a downside move below February 03 high at 1.1033 would expose the asset to the psychological support of 1.1000. Further slippage below the psychological support would drag the major currency pair to June 15 high at 1.0953.
Technical Levels: Supports and Resistances
EURUSD currently trading at 1.1141 at the time of writing. Pair opened at 1.1131 and is trading with a change of 0.09 % .
| Overview | Overview.1 | |
|---|---|---|
| 0 | Today last price | 1.1141 |
| 1 | Today Daily Change | 0.0010 |
| 2 | Today Daily Change % | 0.0900 |
| 3 | Today daily open | 1.1131 |
The pair remains strongly bullish on the daily timeframe. It trades above its 20 SMA @ 1.0938, 50 SMA 1.0861, 100 SMA @ 1.0841 and 200 SMA @ 1.0638.
| Trends | Trends.1 | |
|---|---|---|
| 0 | Daily SMA20 | 1.0938 |
| 1 | Daily SMA50 | 1.0861 |
| 2 | Daily SMA100 | 1.0841 |
| 3 | Daily SMA200 | 1.0638 |
The previous day high was 1.114 while the previous day low was 1.1005. The daily 38.2% Fib levels comes at 1.1089, expected to provide support. Similarly, the daily 61.8% fib level is at 1.1057, expected to provide support.
Note the levels of interest below:
- Pivot support is noted at 1.1044, 1.0956, 1.0908
- Pivot resistance is noted at 1.1179, 1.1228, 1.1315
| Levels | Levels.1 |
|---|---|
| Previous Daily High | 1.1140 |
| Previous Daily Low | 1.1005 |
| Previous Weekly High | 1.0973 |
| Previous Weekly Low | 1.0834 |
| Previous Monthly High | 1.1012 |
| Previous Monthly Low | 1.0662 |
| Daily Fibonacci 38.2% | 1.1089 |
| Daily Fibonacci 61.8% | 1.1057 |
| Daily Pivot Point S1 | 1.1044 |
| Daily Pivot Point S2 | 1.0956 |
| Daily Pivot Point S3 | 1.0908 |
| Daily Pivot Point R1 | 1.1179 |
| Daily Pivot Point R2 | 1.1228 |
| Daily Pivot Point R3 | 1.1315 |
[/s2If]
Download Nehcap EAWe have two EAs that are operational on our LIVE accounts.
- EA-FIX: Check out the details here. Download EA-FIX . EA-FIX is a non-grid HFT scalper.
- EA-GROWTH: High quality low dd EA using trend grids. Download EA_GROWTHJoin Our Telegram Group
")


