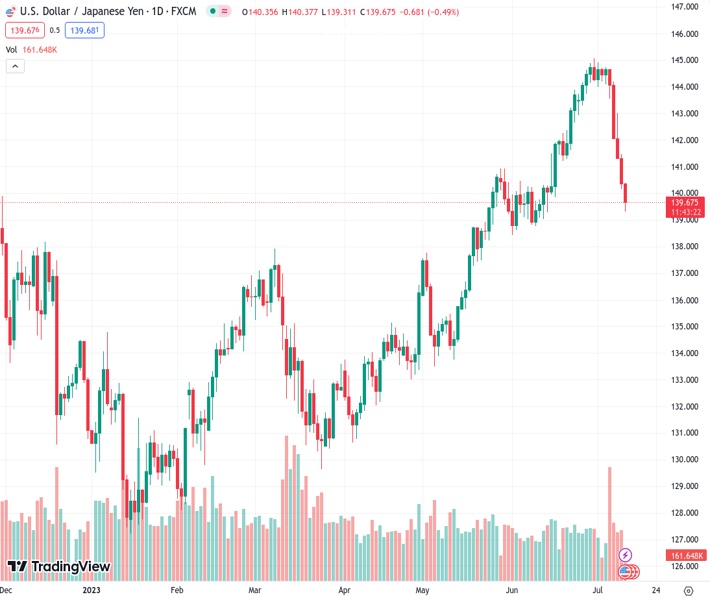
The USDJPY currency pair continues to decline for the fifth consecutive day and reaches its lowest level in almost a month.
…
This is a premium post.
[s2If !current_user_can(access_s2member_level4)]Please register for FREE REGISTER to read full post below containing analysis. In case of any error or you think you are not able to read the full post below, please email us at support#nehcap.com [lwa][/s2If] [s2If current_user_can(access_s2member_level1)]
- USD/JPY prolongs its downfall for the fifth straight day and drops to a nearly one-month trough.
The pair currently trades last at 139.649.
The previous day high was 141.46 while the previous day low was 140.16. The daily 38.2% Fib levels comes at 140.66, expected to provide resistance. Similarly, the daily 61.8% fib level is at 140.96, expected to provide resistance.
The USD/JPY pair extends its recent sharp pullback from the YTD peak – levels just above the 145.00 psychological mark – and continues drifting lower for the fifth successive day on Wednesday. The downward trajectory drags spot prices to the 139.30 level, or a nearly one-month low during the early European session, though pauses near the 38.2% Fibonacci retracement level of the March-June rally.
The bearish pressure surrounding the US Dollar (USD) remains unabated in the wake of speculations that the Federal Reserve (Fed) will end its rate-hiking cycle following a 25 bps lift-off in July. The Japanese Yen (JPY), on the other hand, draws support from expectations that the Bank of Japan (BOJ) will adjust its ultra-loose policy settings as soon as this month, which, in turn, contributes to the USD/JPY pair’s downfall witnessed over the past week or so.
That said, a generally positive tone around the equity markets undermines demand for the safe-haven Japanese Yen (JPY) and lends some support to spot prices. Traders also seem reluctant to place aggressive bets and prefer to wait on the sidelines ahead of the US consumer inflation figures, due for release later during the early North American session. The crucial US CPI report should influence the USD and provide some meaningful impetus to the USD/JPY pair.
In the meantime, the extremely oversold Relative Strength Index (RSI) on hourly charts is seen helping limit the downside, at least for the time being. That said, acceptance below the 50-day Simple Moving Average (SMA) and bearish technical indicators on the daily chart suggest that the path of least resistance for the USD/JPY pair is to the downside. Bears, however, might still wait for some intraday consolidation or a modest bounce before placing fresh bets.
From current levels, the 38.2% Fibo. level could protect the immediate downside ahead of the 139.00 mark, which if broken will be seen as a fresh trigger for bearish traders. The USD/JPY pair might then accelerate the depreciating move towards testing sub-138.00 levels, representing the 61.8% Fibo. level.
On the flip side, the 140.00 psychological mark now seems to act as an immediate hurdle, above which a bout of a short-covering move could lift the USD/JPY pair towards the 140.60 area, representing the 50% Fibo. level. Any subsequent move up, however, might still be seen as a selling opportunity around the 141.00 mark and remain capped near the 141.20-141.25 region. A sustained strength beyond the latter is needed to negate the negative outlook.
Technical Levels: Supports and Resistances
USDJPY currently trading at 139.6 at the time of writing. Pair opened at 140.37 and is trading with a change of -0.55 % .
| Overview | Overview.1 | |
|---|---|---|
| 0 | Today last price | 139.60 |
| 1 | Today Daily Change | -0.77 |
| 2 | Today Daily Change % | -0.55 |
| 3 | Today daily open | 140.37 |
The pair is trading below its 20 Daily moving average @ 142.86, below its 50 Daily moving average @ 139.92 , above its 100 Daily moving average @ 136.92 and above its 200 Daily moving average @ 137.19
| Trends | Trends.1 | |
|---|---|---|
| 0 | Daily SMA20 | 142.86 |
| 1 | Daily SMA50 | 139.92 |
| 2 | Daily SMA100 | 136.92 |
| 3 | Daily SMA200 | 137.19 |
The previous day high was 141.46 while the previous day low was 140.16. The daily 38.2% Fib levels comes at 140.66, expected to provide resistance. Similarly, the daily 61.8% fib level is at 140.96, expected to provide resistance.
Note the levels of interest below:
- Pivot support is noted at 139.87, 139.36, 138.57
- Pivot resistance is noted at 141.17, 141.96, 142.47
| Levels | Levels.1 |
|---|---|
| Previous Daily High | 141.46 |
| Previous Daily Low | 140.16 |
| Previous Weekly High | 144.91 |
| Previous Weekly Low | 142.07 |
| Previous Monthly High | 145.07 |
| Previous Monthly Low | 138.43 |
| Daily Fibonacci 38.2% | 140.66 |
| Daily Fibonacci 61.8% | 140.96 |
| Daily Pivot Point S1 | 139.87 |
| Daily Pivot Point S2 | 139.36 |
| Daily Pivot Point S3 | 138.57 |
| Daily Pivot Point R1 | 141.17 |
| Daily Pivot Point R2 | 141.96 |
| Daily Pivot Point R3 | 142.47 |
[/s2If]
Download Nehcap EAWe have two EAs that are operational on our LIVE accounts.
- EA-FIX: Check out the details here. Download EA-FIX . EA-FIX is a non-grid HFT scalper.
- EA-GROWTH: High quality low dd EA using trend grids. Download EA_GROWTHJoin Our Telegram Group
")


