The USDCAD currency pair experiences a consecutive second day of decline, reaching a two-week low on Wednesday.
…
This is a premium post.
[s2If !current_user_can(access_s2member_level4)]Please register for FREE REGISTER to read full post below containing analysis. In case of any error or you think you are not able to read the full post below, please email us at support#nehcap.com [lwa][/s2If] [s2If current_user_can(access_s2member_level1)]
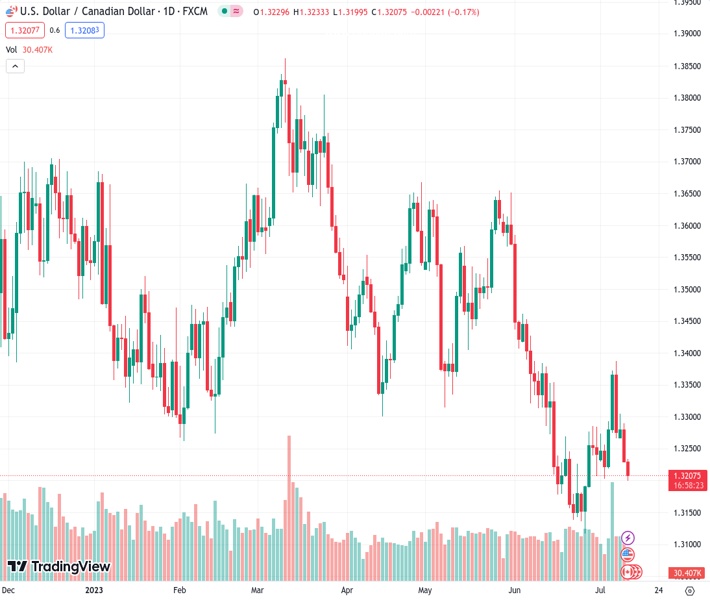
- USD/CAD drifts lower for the second straight day and drops to a two-week low on Wednesday.
The pair currently trades last at 1.32064.
The previous day high was 1.329 while the previous day low was 1.323. The daily 38.2% Fib levels comes at 1.3253, expected to provide resistance. Similarly, the daily 61.8% fib level is at 1.3267, expected to provide resistance.
The USD/CAD pair remains under some selling pressure for the second successive day on Wednesday and extends its rejection slide from the 50-day Simple Moving Average (SMA), around the 1.3385 region, or a one-month high touched last week. The downward trajectory – also marking the third day of a negative move in the previous four – drags spot prices to a two-week low, around the 1.3200 mark during the Asian session and is sponsored by a combination of factors.
Crude Oil prices build on the overnight breakout momentum through the 100-day SMA and jump to the highest level since early May, bolstered by supply cuts announced by the world’s biggest oil exporters – Saudi Arabia and Russia. This, in turn, continues to underpin the commodity-linked Loonie, which, along with sustained US Dollar (USD) selling, further contributes to the offered tone surrounding the USD/CAD pair. In fact, the USD Index (DXY), which tracks the Greenback against a basket of currencies, sinks to a fresh two-month low in the wake of speculations that the Federal Reserve (Fed) is nearing the end of its current rate-hiking cycle.
Investors seem convinced that the US central bank has limited headroom to continue tightening the monetary policy, especially after the New York Fed’s monthly survey revealed on Monday that the one-year consumer inflation expectation dropped to the lowest level since April 2021. Hence, the market focus will remain glued to the release of the latest US consumer inflation figures, due later during the early North American session. The crucial US CPI report is likely to influence expectations about the Fed’s future rate-hike path, which, in turn, will drive the USD demand in the near term and provide some meaningful impetus to the USD/CAD pair.
Apart from this, market participants on Wednesday will take cues from the Bank of Canada (BoC) monetary policy decision. The Canadian central bank is expected to hike interest rates by 25 bps following strong indicators from the domestic CPI report and June’s significant job growth. Investors will further scrutinize BoC Governor Tiff Macklem’s remarks at the post-meeting press conference, which should infuse some volatility around the Canadian Dollar (USD) and help determine the near-term trajectory for the USD/CAD pair.
Technical Levels: Supports and Resistances
USDCAD currently trading at 1.3206 at the time of writing. Pair opened at 1.323 and is trading with a change of -0.18 % .
| Overview | Overview.1 | |
|---|---|---|
| 0 | Today last price | 1.3206 |
| 1 | Today Daily Change | -0.0024 |
| 2 | Today Daily Change % | -0.1800 |
| 3 | Today daily open | 1.3230 |
The pair remains strongly bearish on the daily time frame. It trades below the 20 SMA @ 1.3235, 50 SMA 1.3378, 100 SMA @ 1.3484 and 200 SMA @ 1.35.
| Trends | Trends.1 | |
|---|---|---|
| 0 | Daily SMA20 | 1.3235 |
| 1 | Daily SMA50 | 1.3378 |
| 2 | Daily SMA100 | 1.3484 |
| 3 | Daily SMA200 | 1.3500 |
The previous day high was 1.329 while the previous day low was 1.323. The daily 38.2% Fib levels comes at 1.3253, expected to provide resistance. Similarly, the daily 61.8% fib level is at 1.3267, expected to provide resistance.
Note the levels of interest below:
- Pivot support is noted at 1.3211, 1.3191, 1.3151
- Pivot resistance is noted at 1.327, 1.3309, 1.3329
| Levels | Levels.1 |
|---|---|
| Previous Daily High | 1.3290 |
| Previous Daily Low | 1.3230 |
| Previous Weekly High | 1.3387 |
| Previous Weekly Low | 1.3203 |
| Previous Monthly High | 1.3585 |
| Previous Monthly Low | 1.3117 |
| Daily Fibonacci 38.2% | 1.3253 |
| Daily Fibonacci 61.8% | 1.3267 |
| Daily Pivot Point S1 | 1.3211 |
| Daily Pivot Point S2 | 1.3191 |
| Daily Pivot Point S3 | 1.3151 |
| Daily Pivot Point R1 | 1.3270 |
| Daily Pivot Point R2 | 1.3309 |
| Daily Pivot Point R3 | 1.3329 |
[/s2If]
Download Nehcap EAWe have two EAs that are operational on our LIVE accounts.
- EA-FIX: Check out the details here. Download EA-FIX . EA-FIX is a non-grid HFT scalper.
- EA-GROWTH: High quality low dd EA using trend grids. Download EA_GROWTHJoin Our Telegram Group
")


