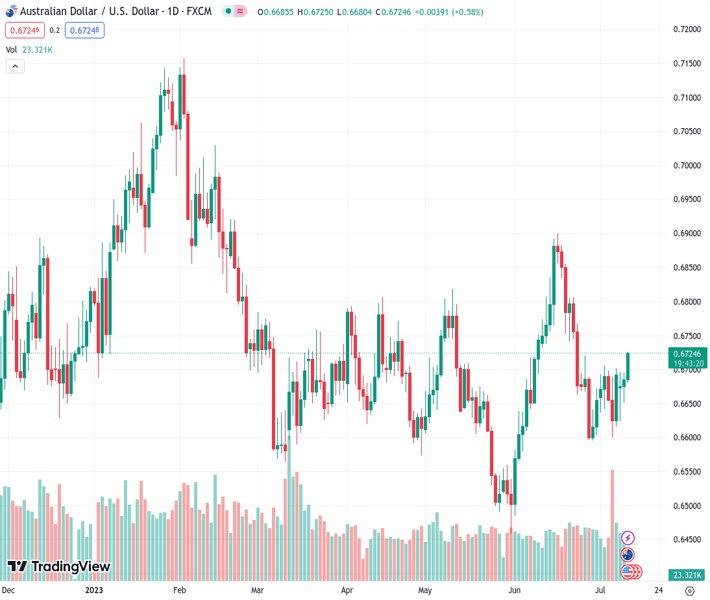
On Wednesday, the Australian Dollar to US Dollar exchange rate, with AUDUSD at 0.67187, experiences renewed buying interest and rises to its highest level in over two weeks.
…
This is a premium post.
[s2If !current_user_can(access_s2member_level4)]Please register for FREE REGISTER to read full post below containing analysis. In case of any error or you think you are not able to read the full post below, please email us at support#nehcap.com [lwa][/s2If] [s2If current_user_can(access_s2member_level1)]
- AUD/USD catches fresh bids on Wednesday and jumps to over a two-week high.
The pair currently trades last at 0.67187.
The previous day high was 0.6695 while the previous day low was 0.6651. The daily 38.2% Fib levels comes at 0.6678, expected to provide support. Similarly, the daily 61.8% fib level is at 0.6668, expected to provide support.
The AUD/USD pair gains some positive traction for the second successive day on Wednesday and spikes to over a two-week peak, around the 0.6715-0.6720 region during the Asian session.
Speculations that the Federal Reserve (Fed) has limited headroom to continue tightening its monetary policy and is nearing the end of its rate-hiking cycle drag the US Dollar (USD) lower for the fifth straight day. In fact, the USD Index (DXY), which tracks the Greenback against a basket of currencies, drops to its lowest level since May 11 and turns out to be a key factor pushing the AUD/USD pair higher.
The US jobs report released on Friday showed that the economy added the fewest jobs in 2-1/2 years, signalling that the labor market is cooling. Adding to this, the New York Fes’s monthly survey revealed on Monday that the one-year consumer inflation expectation dropped to 3.8% in June – the lowest level since April 2021. This could allow the Fed to soften its hawkish stance and continues to weigh on the buck.
This, along with a generally positive tone around the equity markets, is seen as another factor undermining the safe-haven USD and benefitting the risk-sensitive Aussie. Meanwhile, the latest leg-up witnessed over the past hour or so could also be attributed to some technical buying on a sustained strength above the very important 200-day Simple Moving Average (SMA) resistance near the 0.6700 round-figure mark.
Hence, it remains to be seen if the momentum is backed by genuine buying or turns out to be a stop-run as the market focus remains glued to the US consumer inflation figures, due for release later during the early North American session. The crucial US CPI report will influence the Fed’s policy outlook, which, in turn, will drive the USD demand and provide a fresh directional impetus to the AUD/USD pair.
Technical Levels: Supports and Resistances
AUDUSD currently trading at 0.6712 at the time of writing. Pair opened at 0.6687 and is trading with a change of 0.37 % .
| Overview | Overview.1 | |
|---|---|---|
| 0 | Today last price | 0.6712 |
| 1 | Today Daily Change | 0.0025 |
| 2 | Today Daily Change % | 0.3700 |
| 3 | Today daily open | 0.6687 |
The pair is trading below its 20 Daily moving average @ 0.6718, above its 50 Daily moving average @ 0.6678 , above its 100 Daily moving average @ 0.6683 and above its 200 Daily moving average @ 0.6699
| Trends | Trends.1 | |
|---|---|---|
| 0 | Daily SMA20 | 0.6718 |
| 1 | Daily SMA50 | 0.6678 |
| 2 | Daily SMA100 | 0.6683 |
| 3 | Daily SMA200 | 0.6699 |
The previous day high was 0.6695 while the previous day low was 0.6651. The daily 38.2% Fib levels comes at 0.6678, expected to provide support. Similarly, the daily 61.8% fib level is at 0.6668, expected to provide support.
Note the levels of interest below:
- Pivot support is noted at 0.666, 0.6633, 0.6616
- Pivot resistance is noted at 0.6704, 0.6722, 0.6748
| Levels | Levels.1 |
|---|---|
| Previous Daily High | 0.6695 |
| Previous Daily Low | 0.6651 |
| Previous Weekly High | 0.6705 |
| Previous Weekly Low | 0.6599 |
| Previous Monthly High | 0.6900 |
| Previous Monthly Low | 0.6484 |
| Daily Fibonacci 38.2% | 0.6678 |
| Daily Fibonacci 61.8% | 0.6668 |
| Daily Pivot Point S1 | 0.6660 |
| Daily Pivot Point S2 | 0.6633 |
| Daily Pivot Point S3 | 0.6616 |
| Daily Pivot Point R1 | 0.6704 |
| Daily Pivot Point R2 | 0.6722 |
| Daily Pivot Point R3 | 0.6748 |
[/s2If]
Download Nehcap EAWe have two EAs that are operational on our LIVE accounts.
- EA-FIX: Check out the details here. Download EA-FIX . EA-FIX is a non-grid HFT scalper.
- EA-GROWTH: High quality low dd EA using trend grids. Download EA_GROWTHJoin Our Telegram Group
")


