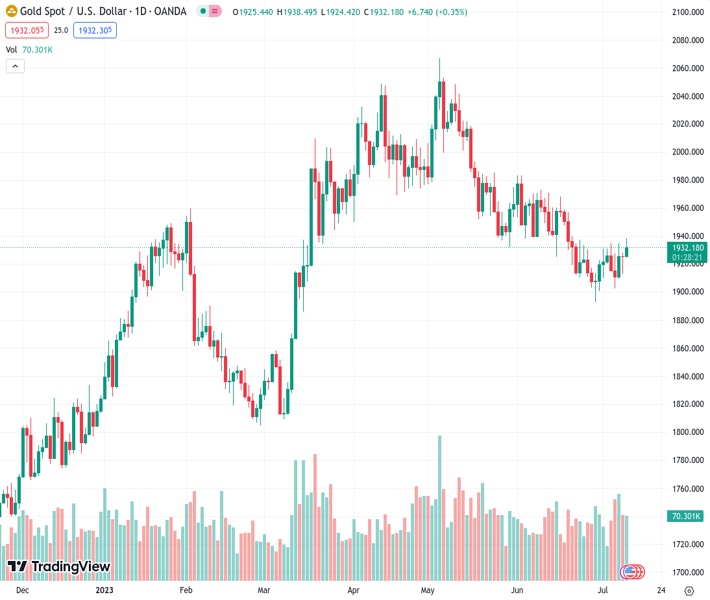
On Tuesday, the XAUUSD pair increased above the $1,930 mark, surpassing the 20-day Simple Moving Average situated at $1,926.
…
This is a premium post.
[s2If !current_user_can(access_s2member_level4)]Please register for FREE REGISTER to read full post below containing analysis. In case of any error or you think you are not able to read the full post below, please email us at support#nehcap.com [lwa][/s2If] [s2If current_user_can(access_s2member_level1)]
- XAU/USD rose past the $1,930 level on Tuesday, piercing through the 20-day SMA at $1,926.
The pair currently trades last at 1932.23.
The previous day high was 1928.18 while the previous day low was 1912.74. The daily 38.2% Fib levels comes at 1922.28, expected to provide support. Similarly, the daily 61.8% fib level is at 1918.64, expected to provide support.
On Tuesday, the Gold spot XAU/USD gained ground and consolidated above the 20-day Simple Moving Average (SMA) for the first time since May. Ahead of key US Consumer Price Index (CPI) figures on Wednesday, US yields are declining giving room to the non-yielding metal to advance.
On Wednesday’s session, the US Bureau of Labor Statistics will release CPI data from June. The headline figure is expected to fall to 3.1% YoY from the previous 4% and the Core measure to 5% from 5.3%. Meanwhile, the US Treasury bond yields, which could be seen as the opportunity cost of holding gold, trade weak, with the 2-year standing at 4.86% and the 5 and 10-year yields falling to 4.22% and 3.96%, respectively.
That being said, hawkish bets on the Federal Reserve (Fed) remain steady. According to the FedWatch tool, investors have already priced in a 25 basis point (bps) hike in the next Fed July meeting and looking forward, they discount a 35% probability of another 25 bps in 2023. However, CPI figures may impact those expectations affecting both the US bond market and the yellow metal price dynamics.
The daily chart suggests that the buyers have taken the lead over the sellers in the short term after conquering the 20-day SMA. However, the bulls still have some work to do to confirm the positive bias and need to retake the 100-day SMA, currently at $1,950. Meanwhile, the Relative Strength Index (RSI) points north, still below its midline, while the Moving Average Convergence Divergence (MACD) prints higher green bars.
Resistance levels: $1,940, 1,950 (100-day SMA), $1,970.
Support levels: $1,915, $1,900, $1,890.
Technical Levels: Supports and Resistances
XAUUSD currently trading at 1931.79 at the time of writing. Pair opened at 1925.29 and is trading with a change of 0.34 % .
| Overview | Overview.1 | |
|---|---|---|
| 0 | Today last price | 1931.79 |
| 1 | Today Daily Change | 6.50 |
| 2 | Today Daily Change % | 0.34 |
| 3 | Today daily open | 1925.29 |
The pair is trading above its 20 Daily moving average @ 1927.58, below its 50 Daily moving average @ 1960.85 , below its 100 Daily moving average @ 1948.83 and above its 200 Daily moving average @ 1867.66
| Trends | Trends.1 | |
|---|---|---|
| 0 | Daily SMA20 | 1927.58 |
| 1 | Daily SMA50 | 1960.85 |
| 2 | Daily SMA100 | 1948.83 |
| 3 | Daily SMA200 | 1867.66 |
The previous day high was 1928.18 while the previous day low was 1912.74. The daily 38.2% Fib levels comes at 1922.28, expected to provide support. Similarly, the daily 61.8% fib level is at 1918.64, expected to provide support.
Note the levels of interest below:
- Pivot support is noted at 1915.96, 1906.63, 1900.52
- Pivot resistance is noted at 1931.4, 1937.51, 1946.84
| Levels | Levels.1 |
|---|---|
| Previous Daily High | 1928.18 |
| Previous Daily Low | 1912.74 |
| Previous Weekly High | 1935.09 |
| Previous Weekly Low | 1902.77 |
| Previous Monthly High | 1983.50 |
| Previous Monthly Low | 1893.01 |
| Daily Fibonacci 38.2% | 1922.28 |
| Daily Fibonacci 61.8% | 1918.64 |
| Daily Pivot Point S1 | 1915.96 |
| Daily Pivot Point S2 | 1906.63 |
| Daily Pivot Point S3 | 1900.52 |
| Daily Pivot Point R1 | 1931.40 |
| Daily Pivot Point R2 | 1937.51 |
| Daily Pivot Point R3 | 1946.84 |
[/s2If]
Download Nehcap EAWe have two EAs that are operational on our LIVE accounts.
- EA-FIX: Check out the details here. Download EA-FIX . EA-FIX is a non-grid HFT scalper.
- EA-GROWTH: High quality low dd EA using trend grids. Download EA_GROWTHJoin Our Telegram Group
")


