The USDMXN exchange rate, currently at 17.1017, has increased by 0.20% due to a slight economic slump and a weaker US Dollar.
…
This is a premium post.
[s2If !current_user_can(access_s2member_level4)]Please register for FREE REGISTER to read full post below containing analysis. In case of any error or you think you are not able to read the full post below, please email us at support#nehcap.com [lwa][/s2If] [s2If current_user_can(access_s2member_level1)]
- USD/MXN is up 0.20% amidst a light economic docker, soft US Dollar.
The pair currently trades last at 17.1017.
The previous day high was 17.1746 while the previous day low was 17.0289. The daily 38.2% Fib levels comes at 17.0846, expected to provide support. Similarly, the daily 61.8% fib level is at 17.1189, expected to provide resistance.
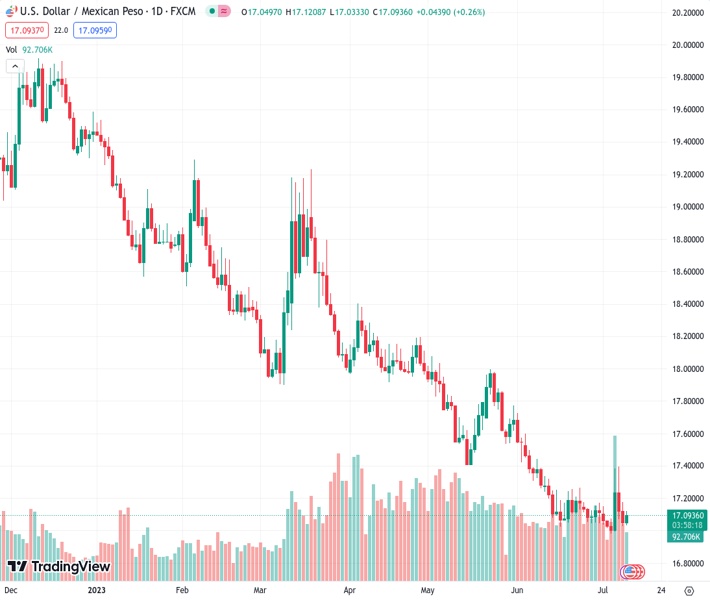
USD/MXN bounces off weekly lows of 17.0285 and climbs despite broad US Dollar(USD) weakness across the board on a light economic docket on both sides of the border between the United States (US) and Mexico. At the time of writing, the USD/MXN is trading at 17.0929, after hitting a daily low of 17.0330, gains 0.20%.
Investors’ mood remains positive ahead of the important inflation report in the US. The Consumer Price Index (CPI) for June is expected to decelerate from 4% to 3.1% in yearly figures, while month-over-month (MoM) is seen at 0.3%, higher than May’s 0.1%. The core CPI for the same period, which excludes volatile items like food and energy, is estimated to dip to 5% YoY from 5.3% in the last month. In comparison, MoM data is estimated at 0.3%, a downtick from the latest 0.4% readings during the previous two months.
In the meantime, Federal Reserve (Fed) speakers remain tilted hawkish, as the Vice Chairman for Supervision Michal Barr said there’s some work to do, while Cleveland’s Fed President Loretta Mester added that “rates would need to move up somewhat further.” At the same time, San Francisco’s Fed President Mary Daly stated that “a couple of more rate hikes over the course of this year” are needed while emphasizing the risks of doing too little are higher than doing too much. Contrarily, Atlanta’s Fed President Raphael Bostic leaned dovish, saying that rates are already in the restrictive territory and that inflation would reach its 2% target.
As of writing, US Treasury bond yields in the short-end of the curve are almost unchanged, while the belly and long-end are dropping, undermining the greenback. The US Dollar Index (DXY), which measures the buck’s performance against a basket of six currencies, slides 0.10%, at 101.792, falling to a new two-month low of 101.666.
On the Mexican front, an absent economic docket will leave traders adrift to US Dollar dynamics and Wednesday’s CPI data. Hot inflation in the US could be positive for the greenback and lift the USD/MXN to re-test the 17.4038 May 17 low-turned resistance. Once that level is breached, the USD/MXN could turn neutral. Factors that could undermine the Mexican Peso (MXN) is a reduction of the interest rate differential, with the Bank of Mexico (Banxico) expected to begin easing monetary policy towards the end of the year, while the Fed has signaled to keep rates “higher for longer.”
The USD/MXN daily chart stills portrays the pair as downward biased but appear to have bottomed at around 17.00 in the near term. On July 6, the USD/MXN posted a gain of 1.35%, forming a bullish engulfing candle that embraced the price action of the prior nine days, suggesting that the USD/MXN consolidation around the 16.9761-17.40 range could be seen as a sign of MXN bulls booking profits, ahead the Banxico’s shift. To the upside, USD/MXN key resistance areas are the 20-day Exponential Moving Average (EMA), at 17.1575, followed by the May 17 daily low-turned resistance at 17.4038. Conversely, support areas lie at 17.0000, followed by the year-to-date (YTD) low of 16.9761.
Technical Levels: Supports and Resistances
USDMXN currently trading at 17.1102 at the time of writing. Pair opened at 17.0522 and is trading with a change of 0.34 % .
| Overview | Overview.1 | |
|---|---|---|
| 0 | Today last price | 17.1102 |
| 1 | Today Daily Change | 0.0580 |
| 2 | Today Daily Change % | 0.3400 |
| 3 | Today daily open | 17.0522 |
The pair remains strongly bearish on the daily time frame. It trades below the 20 SMA @ 17.1205, 50 SMA 17.4338, 100 SMA @ 17.8467 and 200 SMA @ 18.6099.
| Trends | Trends.1 | |
|---|---|---|
| 0 | Daily SMA20 | 17.1205 |
| 1 | Daily SMA50 | 17.4338 |
| 2 | Daily SMA100 | 17.8467 |
| 3 | Daily SMA200 | 18.6099 |
The previous day high was 17.1746 while the previous day low was 17.0289. The daily 38.2% Fib levels comes at 17.0846, expected to provide support. Similarly, the daily 61.8% fib level is at 17.1189, expected to provide resistance.
Note the levels of interest below:
- Pivot support is noted at 16.9959, 16.9396, 16.8503
- Pivot resistance is noted at 17.1416, 17.2308, 17.2872
| Levels | Levels.1 |
|---|---|
| Previous Daily High | 17.1746 |
| Previous Daily Low | 17.0289 |
| Previous Weekly High | 17.3957 |
| Previous Weekly Low | 16.9803 |
| Previous Monthly High | 17.7286 |
| Previous Monthly Low | 17.0243 |
| Daily Fibonacci 38.2% | 17.0846 |
| Daily Fibonacci 61.8% | 17.1189 |
| Daily Pivot Point S1 | 16.9959 |
| Daily Pivot Point S2 | 16.9396 |
| Daily Pivot Point S3 | 16.8503 |
| Daily Pivot Point R1 | 17.1416 |
| Daily Pivot Point R2 | 17.2308 |
| Daily Pivot Point R3 | 17.2872 |
[/s2If]
Download Nehcap EAWe have two EAs that are operational on our LIVE accounts.
- EA-FIX: Check out the details here. Download EA-FIX . EA-FIX is a non-grid HFT scalper.
- EA-GROWTH: High quality low dd EA using trend grids. Download EA_GROWTHJoin Our Telegram Group
")


