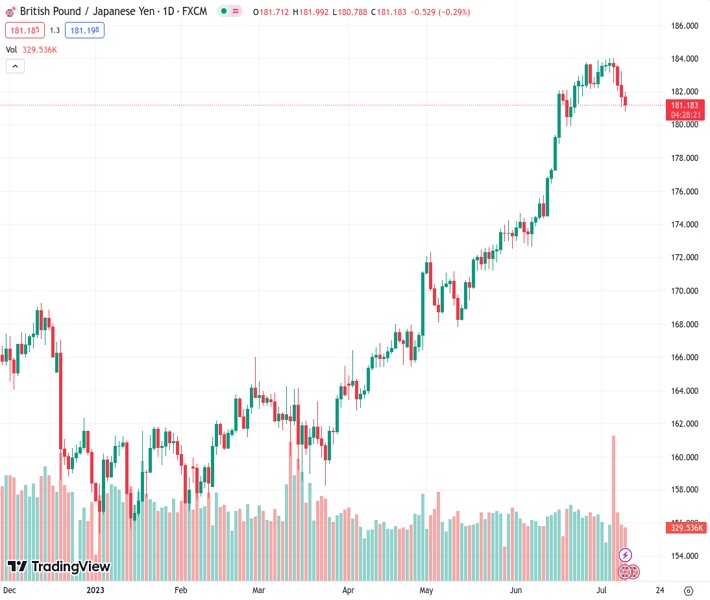
#GBPJPY @ 181.184 The cross tallied a fourth consecutive loss day and retreated near 181.00.
…
This is a premium post.
[s2If !current_user_can(access_s2member_level4)]Please register for FREE REGISTER to read full post below containing analysis. In case of any error or you think you are not able to read the full post below, please email us at support#nehcap.com [lwa][/s2If] [s2If current_user_can(access_s2member_level1)]
- The GBP/JPY cross tallied a fourth consecutive loss day and retreated near 181.00.
The pair currently trades last at 181.184.
The previous day high was 183.23 while the previous day low was 181.1. The daily 38.2% Fib levels comes at 181.91, expected to provide resistance. Similarly, the daily 61.8% fib level is at 182.42, expected to provide resistance.
On Tuesday, the GBP/JPY continued to lose ground and at the time of writing trades at 181.25. In that sense, the GBP is weakening as the Office for National Statistics (ONS) from the UK reported that unemployment picked up in May as wages increased, a red flag for the Bank of England (BoE). On the other hand, falling yields and weak economic data may limit the JPY’s advance.
The National Statistics Office released mixed labour market data. The unemployment rate increased by two ticks to reach 4.0% during the three months leading up to May, its highest since January 2022, while markets expected it to remain steady at 3.8%.On the other hand, there was an improvement in wage growth. Average Weekly Earnings rose by 6.9% year-on-year, surpassing the expected 6.8%, and this figure was also revised upward from a reported 6.5% for April.
Despite the higher unemployment figures, according to the World Interest Rate Probabilities (WIRP), markets are discounting higher odds of a 50 basis points (bps) interest rate hike on August 3rd, followed by another 50 bps hike on September 21st and additional 25 bps increase in Q4, which would see the bank rate peak at 6.5%.
On the other hand, Machine Tool Orders in Japan declined by 21.7% in June YoY, compared to, a slight improvement from the 22.1% decline observed in May. In addition, falling Japanese yields from Japan due to weak data may contribute to limiting the JPY advance. On Wednesday, the May core machine orders will be released, and market expectations predict a year-on-year increase of 0.1%, an improvement from the previous month’s decline of -5.9% in April. The June Producer Price Index (PPI) data will also be reported, with an anticipated year-on-year rate of 4.4%, lower than the previous 5.1%. This set of data will help markets model their expectations regarding the next Bank of Japan (BoJ) steps, affecting the JPY’s price dynamics.
After losing the 20-day Simple Moving Average (SMA), the short-term outlook has turned negative for the GBP/JPY cross. The Relative Strength Index (RSI) points south while the Moving Average Convergence Divergence (MACD) prints higher red bars, indicating that the bears are gaining ground.
Support Levels: 181.00, 180.50, 179.00.
Resistance Levels: 182.01 (20-day SMA), 182.50, 183.00.
Technical Levels: Supports and Resistances
GBPJPY currently trading at 181.26 at the time of writing. Pair opened at 181.74 and is trading with a change of -0.26 % .
| Overview | Overview.1 | |
|---|---|---|
| 0 | Today last price | 181.26 |
| 1 | Today Daily Change | -0.48 |
| 2 | Today Daily Change % | -0.26 |
| 3 | Today daily open | 181.74 |
The pair is trading below its 20 Daily moving average @ 181.87, above its 50 Daily moving average @ 175.96 , above its 100 Daily moving average @ 170.04 and above its 200 Daily moving average @ 166.81
| Trends | Trends.1 | |
|---|---|---|
| 0 | Daily SMA20 | 181.87 |
| 1 | Daily SMA50 | 175.96 |
| 2 | Daily SMA100 | 170.04 |
| 3 | Daily SMA200 | 166.81 |
The previous day high was 183.23 while the previous day low was 181.1. The daily 38.2% Fib levels comes at 181.91, expected to provide resistance. Similarly, the daily 61.8% fib level is at 182.42, expected to provide resistance.
Note the levels of interest below:
- Pivot support is noted at 180.82, 179.9, 178.7
- Pivot resistance is noted at 182.94, 184.15, 185.07
| Levels | Levels.1 |
|---|---|
| Previous Daily High | 183.23 |
| Previous Daily Low | 181.10 |
| Previous Weekly High | 184.02 |
| Previous Weekly Low | 182.02 |
| Previous Monthly High | 183.88 |
| Previous Monthly Low | 172.67 |
| Daily Fibonacci 38.2% | 181.91 |
| Daily Fibonacci 61.8% | 182.42 |
| Daily Pivot Point S1 | 180.82 |
| Daily Pivot Point S2 | 179.90 |
| Daily Pivot Point S3 | 178.70 |
| Daily Pivot Point R1 | 182.94 |
| Daily Pivot Point R2 | 184.15 |
| Daily Pivot Point R3 | 185.07 |
[/s2If]
Download Nehcap EAWe have two EAs that are operational on our LIVE accounts.
- EA-FIX: Check out the details here. Download EA-FIX . EA-FIX is a non-grid HFT scalper.
- EA-GROWTH: High quality low dd EA using trend grids. Download EA_GROWTHJoin Our Telegram Group
")


