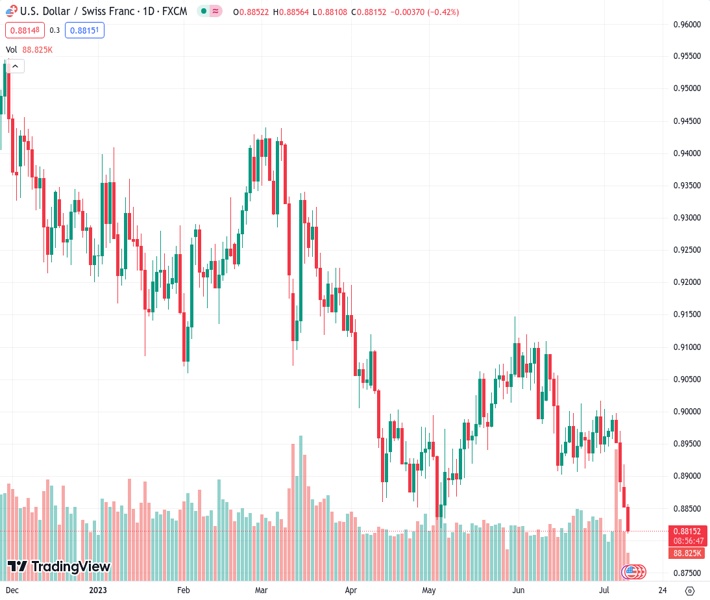
The USDCHF pair has fallen close to the 0.8800 level due to a strong selling pressure on the USD Index.
…
This is a premium post.
[s2If !current_user_can(access_s2member_level4)]Please register for FREE REGISTER to read full post below containing analysis. In case of any error or you think you are not able to read the full post below, please email us at support#nehcap.com [lwa][/s2If] [s2If current_user_can(access_s2member_level1)]
- USD/CHF has stretched its downside to near 0.8800 amid an intense sell-off in the USD Index.
The pair currently trades last at 0.88181.
The previous day high was 0.8918 while the previous day low was 0.8852. The daily 38.2% Fib levels comes at 0.8877, expected to provide resistance. Similarly, the daily 61.8% fib level is at 0.8893, expected to provide resistance.
The USD/CHF pair has extended its downside to near 0.8800 in the European session as market sentiment is extremely cheerful. The Swiss Franc asset has faced an intense sell-off following negative cues from the US Dollar Index (DXY).
S&P500 futures have added decent gains in London, portraying further strength in the risk-taking ability of the market participants. The USD Index has found intermediate support near 101.70 but is insufficient to be recognized as a bullish reversal.
Meanwhile, investors are awaiting the United States Consumer Price Index (CPI) for further guidance. Headline inflation is expected to soften further amid a sheer decline in gasoline prices while core inflation could remain sticky amid higher labor costs.
USD/CHF has dropped perpendicularly to near May’s low around 0.8820 on a four-hour scale. Momentum has remained extremely solid in the recent downfall. The 20-period Exponential Moving Average (EMA) at 0.8890 is far from the Swiss Franc prices, which stems chances of a mean-reversion move
The Relative Strength Index (RSI) (14) is oscillating in the 40.00-60.00 range, indicating sheer strength in the downside momentum.
A further breakdown below the intraday low at 0.8810 would expose the asset to 07 January 2021 low at 0.8774 and 06 January 2021 low at 0.8758.
In an alternate scenario, a recovery move above April 26 low at 0.8852 would drive the asset toward the round-level resistance at 0.8900 followed by June 30 low at 0.8935.
Technical Levels: Supports and Resistances
USDCHF currently trading at 0.8818 at the time of writing. Pair opened at 0.8854 and is trading with a change of -0.41 % .
| Overview | Overview.1 | |
|---|---|---|
| 0 | Today last price | 0.8818 |
| 1 | Today Daily Change | -0.0036 |
| 2 | Today Daily Change % | -0.4100 |
| 3 | Today daily open | 0.8854 |
The pair remains strongly bearish on the daily time frame. It trades below the 20 SMA @ 0.8957, 50 SMA 0.8982, 100 SMA @ 0.9067 and 200 SMA @ 0.9277.
| Trends | Trends.1 | |
|---|---|---|
| 0 | Daily SMA20 | 0.8957 |
| 1 | Daily SMA50 | 0.8982 |
| 2 | Daily SMA100 | 0.9067 |
| 3 | Daily SMA200 | 0.9277 |
The previous day high was 0.8918 while the previous day low was 0.8852. The daily 38.2% Fib levels comes at 0.8877, expected to provide resistance. Similarly, the daily 61.8% fib level is at 0.8893, expected to provide resistance.
Note the levels of interest below:
- Pivot support is noted at 0.8831, 0.8809, 0.8765
- Pivot resistance is noted at 0.8897, 0.8941, 0.8963
| Levels | Levels.1 |
|---|---|
| Previous Daily High | 0.8918 |
| Previous Daily Low | 0.8852 |
| Previous Weekly High | 0.9005 |
| Previous Weekly Low | 0.8876 |
| Previous Monthly High | 0.9120 |
| Previous Monthly Low | 0.8902 |
| Daily Fibonacci 38.2% | 0.8877 |
| Daily Fibonacci 61.8% | 0.8893 |
| Daily Pivot Point S1 | 0.8831 |
| Daily Pivot Point S2 | 0.8809 |
| Daily Pivot Point S3 | 0.8765 |
| Daily Pivot Point R1 | 0.8897 |
| Daily Pivot Point R2 | 0.8941 |
| Daily Pivot Point R3 | 0.8963 |
[/s2If]
Download Nehcap EAWe have two EAs that are operational on our LIVE accounts.
- EA-FIX: Check out the details here. Download EA-FIX . EA-FIX is a non-grid HFT scalper.
- EA-GROWTH: High quality low dd EA using trend grids. Download EA_GROWTHJoin Our Telegram Group
")


