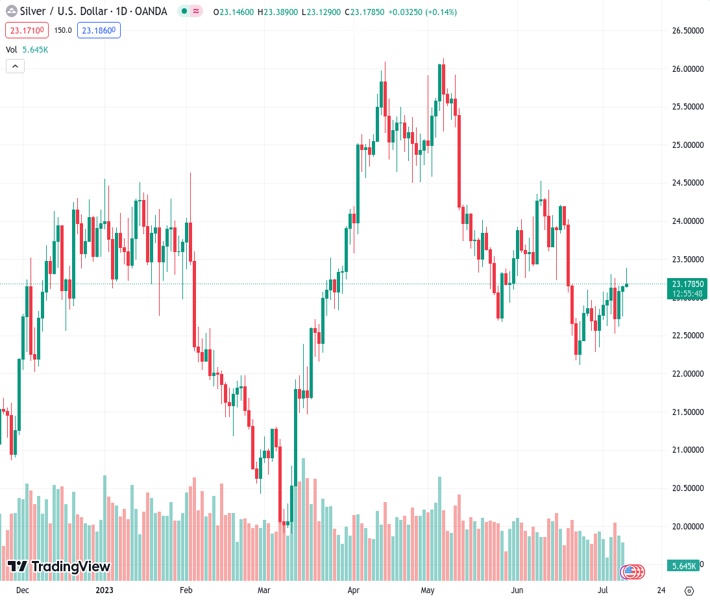
Silver reaches its highest point in three weeks during the early European session on Tuesday, with the XAGUSD pair standing at 23.184.
…
This is a premium post.
[s2If !current_user_can(access_s2member_level4)]Please register for FREE REGISTER to read full post below containing analysis. In case of any error or you think you are not able to read the full post below, please email us at support#nehcap.com [lwa][/s2If] [s2If current_user_can(access_s2member_level1)]
- Silver climbs to a three-week high during the early European session on Tuesday.
The pair currently trades last at 23.184.
The previous day high was 23.16 while the previous day low was 22.75. The daily 38.2% Fib levels comes at 23.0, expected to provide support. Similarly, the daily 61.8% fib level is at 22.91, expected to provide support.
Silver regains positive traction following the previous day’s good two-way price swings and jumps to a three-week high during the early part of the European session on Tuesday. The white metal, however, struggles to find acceptance or build on the move beyond the $23.35-$23.40 confluence – comprising the 200-period Simple Moving Average (SMA) on the 4-hour chart and the 50% Fibonacci retracement level of the downfall from the June swing high.
Looking at the broader picture, the formation of an ascending channel from the vicinity of the $22.00 mark, or the multi-month low touched in June, points to a well-established short-term bullish trend. Moreover, technical indicators on hourly charts are holding comfortably in bullish territory and have just started gaining positive traction on the daily chart. This adds credence to the constructive setup and supports prospects for a further near-term appreciating move.
Bulls, however, might still wait for a sustained strength above the $23.35-$23.40 confluence before positioning for a move towards testing the 61.8% Fibo., around the $23.60 region, en route to the $24.00 round figure. The positive momentum could get extended further towards the $24.20-$24.25 intermediate barrier en route to the June monthly swing high, around the $24.55 region. The XAG/USD might eventually aim towards reclaiming the $25.00 psychological mark.
On the flip side, the 38.2% Fibo., around the $23.00 round figure, now seems to act as immediate support. Any further slide is likely to attract some buying and remain limited near the $22.65-$22.70 area, or the 23.6% Fibo. level. A convincing break below the latter could make the XAG/USD vulnerable to sliding back towards the $22.mark. Some follow-through selling should pave the way for fall towards the $21.70-$21.65 zone en route to the $21.25 support and the $21.00 mark.
Technical Levels: Supports and Resistances
XAGUSD currently trading at 23.26 at the time of writing. Pair opened at 23.14 and is trading with a change of 0.52 % .
| Overview | Overview.1 | |
|---|---|---|
| 0 | Today last price | 23.26 |
| 1 | Today Daily Change | 0.12 |
| 2 | Today Daily Change % | 0.52 |
| 3 | Today daily open | 23.14 |
The pair is trading above its 20 Daily moving average @ 23.09, below its 50 Daily moving average @ 23.7 , below its 100 Daily moving average @ 23.42 and above its 200 Daily moving average @ 22.7
| Trends | Trends.1 | |
|---|---|---|
| 0 | Daily SMA20 | 23.09 |
| 1 | Daily SMA50 | 23.70 |
| 2 | Daily SMA100 | 23.42 |
| 3 | Daily SMA200 | 22.70 |
The previous day high was 23.16 while the previous day low was 22.75. The daily 38.2% Fib levels comes at 23.0, expected to provide support. Similarly, the daily 61.8% fib level is at 22.91, expected to provide support.
Note the levels of interest below:
- Pivot support is noted at 22.87, 22.61, 22.47
- Pivot resistance is noted at 23.28, 23.42, 23.68
| Levels | Levels.1 |
|---|---|
| Previous Daily High | 23.16 |
| Previous Daily Low | 22.75 |
| Previous Weekly High | 23.31 |
| Previous Weekly Low | 22.52 |
| Previous Monthly High | 24.53 |
| Previous Monthly Low | 22.11 |
| Daily Fibonacci 38.2% | 23.00 |
| Daily Fibonacci 61.8% | 22.91 |
| Daily Pivot Point S1 | 22.87 |
| Daily Pivot Point S2 | 22.61 |
| Daily Pivot Point S3 | 22.47 |
| Daily Pivot Point R1 | 23.28 |
| Daily Pivot Point R2 | 23.42 |
| Daily Pivot Point R3 | 23.68 |
[/s2If]
Download Nehcap EAWe have two EAs that are operational on our LIVE accounts.
- EA-FIX: Check out the details here. Download EA-FIX . EA-FIX is a non-grid HFT scalper.
- EA-GROWTH: High quality low dd EA using trend grids. Download EA_GROWTHJoin Our Telegram Group
")


