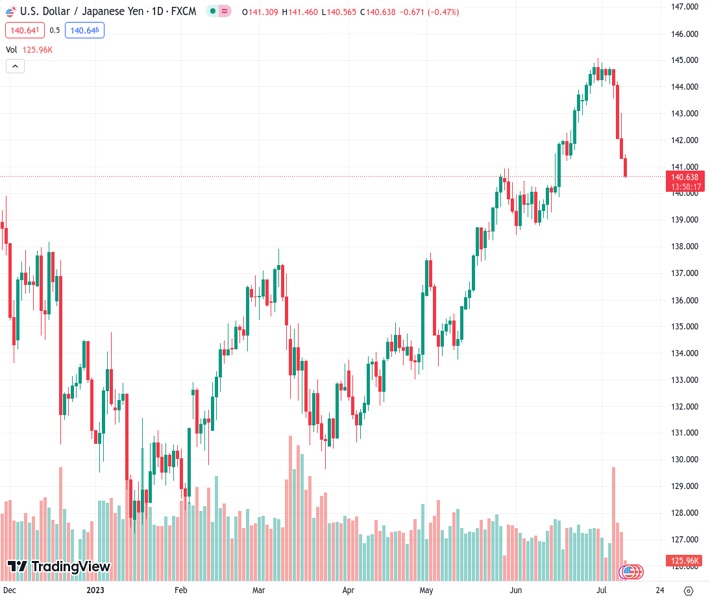
The USDJPY currency pair has reached its lowest point in three weeks, falling for the fourth day in a row. Analysts predict that the drop in value will not be significant.
…
This is a premium post.
[s2If !current_user_can(access_s2member_level4)]Please register for FREE REGISTER to read full post below containing analysis. In case of any error or you think you are not able to read the full post below, please email us at support#nehcap.com [lwa][/s2If] [s2If current_user_can(access_s2member_level1)]
- USD/JPY drops to the lowest level in three weeks, down for the fourth consecutive day.
The pair currently trades last at 140.621.
The previous day high was 143.0 while the previous day low was 141.28. The daily 38.2% Fib levels comes at 141.94, expected to provide resistance. Similarly, the daily 61.8% fib level is at 142.35, expected to provide resistance.
USD/JPY remains on the back foot for the fourth consecutive day as sellers attack May’s peak below 141.00, down 0.50% intraday near 140.60 heading into Tuesday’s European session.
In doing so, the Yen pair renews a three-week low while extending the previous week’s downside break of the 21-DMA and 61.8% Fibonacci retracement level of October 2022 to January 2023 downside. It’s worth noting that the bearish MACD signals add strength to the downside bias.
With this, the risk-barometer pair appears all-set to break the 140.00 psychological magnet with an aim to test the 50% Fibonacci retracement level surrounding 139.60.
However, the bottom line of a bullish megaphone trend-widening chart pattern comprising levels marked since late March, around 139.00 by the press time, appears a tough nut to crack for the USD/JPY bears.
Following that, the 200-DMA and an ascending support line from January, respectively near 137.20 and 134.90, will be in the spotlight for the Yen pair sellers.
Alternatively, the 61.8% Fibonacci retracement and the 21-DMA, close to 142.50 and 142.75 in that order, restrict the short-term upside of the USD/JPY pair.
More importantly, a horizontal area encompassing multiple levels marked since October 2022, near 145.10-15, appears a tough nut to crack for the USD/JPY bulls.
Trend: Limited downside expected
Technical Levels: Supports and Resistances
USDJPY currently trading at 140.72 at the time of writing. Pair opened at 141.31 and is trading with a change of -0.42% % .
| Overview | Overview.1 | |
|---|---|---|
| 0 | Today last price | 140.72 |
| 1 | Today Daily Change | -0.59 |
| 2 | Today Daily Change % | -0.42% |
| 3 | Today daily open | 141.31 |
The pair is trading below its 20 Daily moving average @ 142.86, above its 50 Daily moving average @ 139.84 , above its 100 Daily moving average @ 136.87 and above its 200 Daily moving average @ 137.21
| Trends | Trends.1 | |
|---|---|---|
| 0 | Daily SMA20 | 142.86 |
| 1 | Daily SMA50 | 139.84 |
| 2 | Daily SMA100 | 136.87 |
| 3 | Daily SMA200 | 137.21 |
The previous day high was 143.0 while the previous day low was 141.28. The daily 38.2% Fib levels comes at 141.94, expected to provide resistance. Similarly, the daily 61.8% fib level is at 142.35, expected to provide resistance.
Note the levels of interest below:
- Pivot support is noted at 140.72, 140.14, 139.0
- Pivot resistance is noted at 142.45, 143.59, 144.18
| Levels | Levels.1 |
|---|---|
| Previous Daily High | 143.00 |
| Previous Daily Low | 141.28 |
| Previous Weekly High | 144.91 |
| Previous Weekly Low | 142.07 |
| Previous Monthly High | 145.07 |
| Previous Monthly Low | 138.43 |
| Daily Fibonacci 38.2% | 141.94 |
| Daily Fibonacci 61.8% | 142.35 |
| Daily Pivot Point S1 | 140.72 |
| Daily Pivot Point S2 | 140.14 |
| Daily Pivot Point S3 | 139.00 |
| Daily Pivot Point R1 | 142.45 |
| Daily Pivot Point R2 | 143.59 |
| Daily Pivot Point R3 | 144.18 |
[/s2If]
Download Nehcap EAWe have two EAs that are operational on our LIVE accounts.
- EA-FIX: Check out the details here. Download EA-FIX . EA-FIX is a non-grid HFT scalper.
- EA-GROWTH: High quality low dd EA using trend grids. Download EA_GROWTHJoin Our Telegram Group
")


