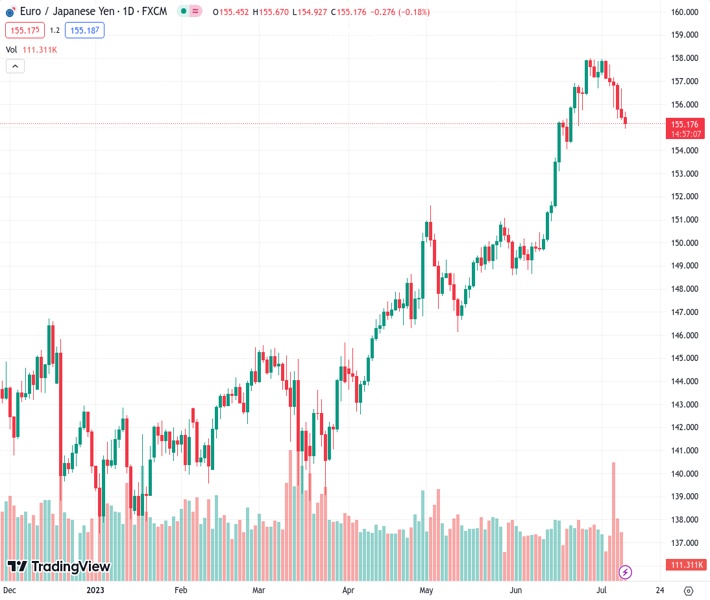
The EURJPY currency pair has reached its lowest point in the past three weeks, declining for six consecutive days. According to the viewpoint of @nehcap, it is anticipated that there will be more downward movement.
…
This is a premium post.
[s2If !current_user_can(access_s2member_level4)]Please register for FREE REGISTER to read full post below containing analysis. In case of any error or you think you are not able to read the full post below, please email us at support#nehcap.com [lwa][/s2If] [s2If current_user_can(access_s2member_level1)]
- EUR/JPY drops to the lowest level in three weeks, down for the sixth consecutive day.
The pair currently trades last at 155.120.
The previous day high was 156.67 while the previous day low was 155.33. The daily 38.2% Fib levels comes at 155.84, expected to provide resistance. Similarly, the daily 61.8% fib level is at 156.16, expected to provide resistance.
EUR/JPY remains on the back foot for the sixth consecutive day as it flashes the 154.93 figure heading into Tuesday’s European session. In doing so, the cross-currency pair declines to the lowest levels in three weeks.
That said, a clear downside break of the 21-DMA, near 155.85 by the press time, joins the bearish MACD signals and the RSI (14) line’s U-turn from the overbought territory to suggest the quote’s further downside.
However, a convergence of the previous resistance line from late October 2022 and ascending trend line from March 24, close to the 152.00 round figure, appears a tough nut to crack for the EUR/JPY bears.
If at all the quote remains bearish past 152.00, Mays high near 151.60 and the 150.00 psychological magnet will entertain the EUR/JPY bears before directing them to the 100-DMA support of around 148.40.
Meanwhile, a daily closing beyond the 21-DMA, around 155.85 at the latest, could recall the short-term buyers of the EUR/JPY pair.
Though, a slew of resistances around the 158.00 and the 160.00 round figure will challenge the bulls afterward.
Trend: Further downside expected
Technical Levels: Supports and Resistances
EURJPY currently trading at 155.09 at the time of writing. Pair opened at 155.46 and is trading with a change of -0.24% % .
| Overview | Overview.1 | |
|---|---|---|
| 0 | Today last price | 155.09 |
| 1 | Today Daily Change | -0.37 |
| 2 | Today Daily Change % | -0.24% |
| 3 | Today daily open | 155.46 |
The pair is trading below its 20 Daily moving average @ 155.9, above its 50 Daily moving average @ 151.86 , above its 100 Daily moving average @ 148.26 and above its 200 Daily moving average @ 145.68
| Trends | Trends.1 | |
|---|---|---|
| 0 | Daily SMA20 | 155.90 |
| 1 | Daily SMA50 | 151.86 |
| 2 | Daily SMA100 | 148.26 |
| 3 | Daily SMA200 | 145.68 |
The previous day high was 156.67 while the previous day low was 155.33. The daily 38.2% Fib levels comes at 155.84, expected to provide resistance. Similarly, the daily 61.8% fib level is at 156.16, expected to provide resistance.
Note the levels of interest below:
- Pivot support is noted at 154.97, 154.48, 153.62
- Pivot resistance is noted at 156.32, 157.17, 157.66
| Levels | Levels.1 |
|---|---|
| Previous Daily High | 156.67 |
| Previous Daily Low | 155.33 |
| Previous Weekly High | 157.96 |
| Previous Weekly Low | 155.38 |
| Previous Monthly High | 158.00 |
| Previous Monthly Low | 148.62 |
| Daily Fibonacci 38.2% | 155.84 |
| Daily Fibonacci 61.8% | 156.16 |
| Daily Pivot Point S1 | 154.97 |
| Daily Pivot Point S2 | 154.48 |
| Daily Pivot Point S3 | 153.62 |
| Daily Pivot Point R1 | 156.32 |
| Daily Pivot Point R2 | 157.17 |
| Daily Pivot Point R3 | 157.66 |
[/s2If]
Download Nehcap EAWe have two EAs that are operational on our LIVE accounts.
- EA-FIX: Check out the details here. Download EA-FIX . EA-FIX is a non-grid HFT scalper.
- EA-GROWTH: High quality low dd EA using trend grids. Download EA_GROWTHJoin Our Telegram Group
")


