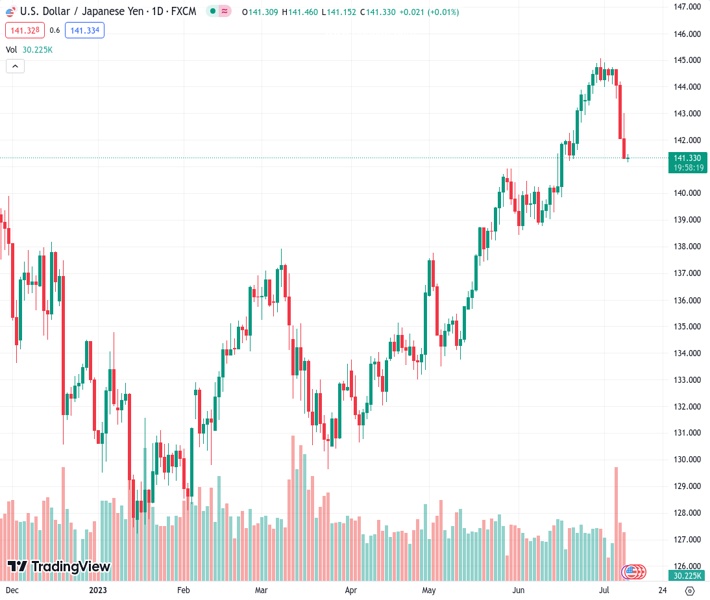
The USDJPY pair is hovering close to a multi-week low as the prevailing sentiment is selling the US dollar.
…
This is a premium post.
[s2If !current_user_can(access_s2member_level4)]Please register for FREE REGISTER to read full post below containing analysis. In case of any error or you think you are not able to read the full post below, please email us at support#nehcap.com [lwa][/s2If] [s2If current_user_can(access_s2member_level1)]
- USD/JPY languishes near a multi-week low amid the prevalent USD selling bias.
The pair currently trades last at 141.345.
The previous day high was 143.0 while the previous day low was 141.28. The daily 38.2% Fib levels comes at 141.94, expected to provide resistance. Similarly, the daily 61.8% fib level is at 142.35, expected to provide resistance.
The USD/JPY pair is seen oscillating in a narrow trading band, just below mid-141.00s during the Asian session on Tuesday and consolidating its losses registered over the past three days to over a three-week low touched the previous day.
The US Dollar (USD) languishes near its lowest level since June 22 in the wake of speculations that the Federal Reserve (Fed) will soften its hawkish stance sooner rather than later and turns out to be a key factor acting as a headwind for the USD/JPY pair. In fact, two Fed officials said Monday that the end to the current monetary policy tightening cycle is getting close, which led to the overnight decline in the US Treasury bond yields and keeps the USD bulls on the defensive.
The Fed speakers, however, noted that the US central bank will likely need to raise interest rates further to bring down inflation. This, in turn, reaffirms market bets for a 25 bps lift-off at the upcoming FOMC policy meeting on July 25-26, which should act as a tailwind for the US bond yields and help limit deeper losses for the buck. Furthermore, expectations that the Bank of Japan (BoJ) will stick to its dovish stance might hold back bears from placing fresh bets around the USD/JPY pair.
Market participants seem convinced that BoJ’s negative interest-rate policy will remain in place at least until next year. Adding to this, BoJ Deputy Governor Shinichi Uchida reportedly said last Friday that the central bank will maintain its yield curve control (YCC) policy from the perspective of sustaining ultra-loose monetary conditions. This warrants caution before positioning for an extension of the USD/JPY pair’s recent pullback from the 145.00 mark, or the YTD peak touched last week.
Traders might also prefer to wait on the sidelines ahead of the release of the latest US consumer inflation figures on Wednesday, which will play a key role in influencing the Fed’s near-term policy outlook and the USD price dynamics. In the meantime, the US bond yields might drive the USD demand and provide some impetus to the USD/JPY pair in the absence of any relevant market-moving economic releases from the US on Tuesday.
Technical Levels: Supports and Resistances
USDJPY currently trading at 141.29 at the time of writing. Pair opened at 141.31 and is trading with a change of -0.01 % .
| Overview | Overview.1 | |
|---|---|---|
| 0 | Today last price | 141.29 |
| 1 | Today Daily Change | -0.02 |
| 2 | Today Daily Change % | -0.01 |
| 3 | Today daily open | 141.31 |
The pair is trading below its 20 Daily moving average @ 142.86, above its 50 Daily moving average @ 139.84 , above its 100 Daily moving average @ 136.87 and above its 200 Daily moving average @ 137.21
| Trends | Trends.1 | |
|---|---|---|
| 0 | Daily SMA20 | 142.86 |
| 1 | Daily SMA50 | 139.84 |
| 2 | Daily SMA100 | 136.87 |
| 3 | Daily SMA200 | 137.21 |
The previous day high was 143.0 while the previous day low was 141.28. The daily 38.2% Fib levels comes at 141.94, expected to provide resistance. Similarly, the daily 61.8% fib level is at 142.35, expected to provide resistance.
Note the levels of interest below:
- Pivot support is noted at 140.72, 140.14, 139.0
- Pivot resistance is noted at 142.45, 143.59, 144.18
| Levels | Levels.1 |
|---|---|
| Previous Daily High | 143.00 |
| Previous Daily Low | 141.28 |
| Previous Weekly High | 144.91 |
| Previous Weekly Low | 142.07 |
| Previous Monthly High | 145.07 |
| Previous Monthly Low | 138.43 |
| Daily Fibonacci 38.2% | 141.94 |
| Daily Fibonacci 61.8% | 142.35 |
| Daily Pivot Point S1 | 140.72 |
| Daily Pivot Point S2 | 140.14 |
| Daily Pivot Point S3 | 139.00 |
| Daily Pivot Point R1 | 142.45 |
| Daily Pivot Point R2 | 143.59 |
| Daily Pivot Point R3 | 144.18 |
[/s2If]
Download Nehcap EAWe have two EAs that are operational on our LIVE accounts.
- EA-FIX: Check out the details here. Download EA-FIX . EA-FIX is a non-grid HFT scalper.
- EA-GROWTH: High quality low dd EA using trend grids. Download EA_GROWTHJoin Our Telegram Group
")


