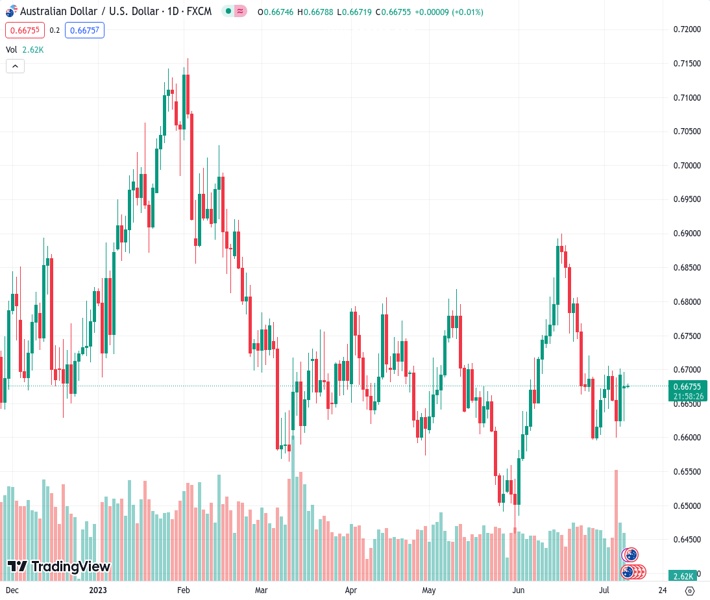
The AUDUSD pair is currently being traded at approximately 0.6670, showing signs of stability after a turbulent session on Monday.
…
This is a premium post.
[s2If !current_user_can(access_s2member_level4)]Please register for FREE REGISTER to read full post below containing analysis. In case of any error or you think you are not able to read the full post below, please email us at support#nehcap.com [lwa][/s2If] [s2If current_user_can(access_s2member_level1)]
- AUD/USD currently trades at around the 0.6670 level, with the pair showing signs of stability following a volatile Monday session.
The pair currently trades last at 0.66753.
The previous day high was 0.6701 while the previous day low was 0.662. The daily 38.2% Fib levels comes at 0.667, expected to provide support. Similarly, the daily 61.8% fib level is at 0.6651, expected to provide support.
AUD/USD hovers around the 0.6670 region as the Asian session begins, following Monday’s volatile session, with the pair unable to get a clear direction, though closed below solid resistance of the 50 and 20-day Exponential Moving Averages (EMAs), each at 0.6686/82. The AUD/USD exchanges hands at 0.6677.
Wall Street finished with gains, an improvement in market sentiment. The last week’s US employment report, although mixed with the economy adding just 209K jobs, witnessed Average Hourly Earnings (AHE) rising while the Unemployment Rate edged lower. Hence it suggests the labor market remains tight, warranting further action by the US Federal Reserve (Fed)
The central bank bonanza continued amid the lack of economic data in the docket. Cleveland Fed President Loretta Mester commented that the economy is still robust while saying, “When the economy reopened, labor demand well outpaced labor supply, putting upward pressure on wages and price inflation.” She stated, “More hikes needed to bring inflation back down to target.”
Echoing some of her comments was the San Francisco Fed President Mary Daly, stating there’s more to be done, opening the door for a couple of hikes. She added that inflation and growth risks became more “balanced,” but the chances of doing too little outpace the threats of overtightening.
Even though the comments were hawkishly tilted, the AUD/USD failed to dive further, with the pair gaining traction. The Australian economic docket will feature the Westpac Consumer Confidence report for July; at the same time, the National Australia Bank’s reveal Business Conditions and Confidence.
Regarding the US economic agenda, further Fed speakers will be featured ahead of Wednesday’s US inflation data.
The AUD/USD trades nearby the confluence of the 20 and 50-day EMAs, with resistance levels ahead of the 0.6700 figure. It should be said that a breach of that area will expose the 200-day Exponential Moving Average (EMA) at 0.674, which could be seen as a bullish signal that could lift prices to the 0.6800 mark.
Nevertheless, the AUD/USD path of least resistance is downwards, as shown by the Relative Strength Index (RSI), which remains bearish territory. That, alongside strong resistance above the current exchange rates, could pave the way to test the July 6 daily low of 0.6599, ahead of testing the May 30 daily high at 0.6559.
Technical Levels: Supports and Resistances
AUDUSD currently trading at 0.6676 at the time of writing. Pair opened at 0.6691 and is trading with a change of -0.22 % .
| Overview | Overview.1 | |
|---|---|---|
| 0 | Today last price | 0.6676 |
| 1 | Today Daily Change | -0.0015 |
| 2 | Today Daily Change % | -0.2200 |
| 3 | Today daily open | 0.6691 |
The pair remains strongly bearish on the daily time frame. It trades below the 20 SMA @ 0.6726, 50 SMA 0.6677, 100 SMA @ 0.6687 and 200 SMA @ 0.6697.
| Trends | Trends.1 | |
|---|---|---|
| 0 | Daily SMA20 | 0.6726 |
| 1 | Daily SMA50 | 0.6677 |
| 2 | Daily SMA100 | 0.6687 |
| 3 | Daily SMA200 | 0.6697 |
The previous day high was 0.6701 while the previous day low was 0.662. The daily 38.2% Fib levels comes at 0.667, expected to provide support. Similarly, the daily 61.8% fib level is at 0.6651, expected to provide support.
Note the levels of interest below:
- Pivot support is noted at 0.664, 0.6589, 0.6559
- Pivot resistance is noted at 0.6722, 0.6752, 0.6803
| Levels | Levels.1 |
|---|---|
| Previous Daily High | 0.6701 |
| Previous Daily Low | 0.6620 |
| Previous Weekly High | 0.6705 |
| Previous Weekly Low | 0.6599 |
| Previous Monthly High | 0.6900 |
| Previous Monthly Low | 0.6484 |
| Daily Fibonacci 38.2% | 0.6670 |
| Daily Fibonacci 61.8% | 0.6651 |
| Daily Pivot Point S1 | 0.6640 |
| Daily Pivot Point S2 | 0.6589 |
| Daily Pivot Point S3 | 0.6559 |
| Daily Pivot Point R1 | 0.6722 |
| Daily Pivot Point R2 | 0.6752 |
| Daily Pivot Point R3 | 0.6803 |
[/s2If]
Download Nehcap EAWe have two EAs that are operational on our LIVE accounts.
- EA-FIX: Check out the details here. Download EA-FIX . EA-FIX is a non-grid HFT scalper.
- EA-GROWTH: High quality low dd EA using trend grids. Download EA_GROWTHJoin Our Telegram Group
")


