Silver (XAG) is experiencing a small increase in trading due to the decrease in US Treasury bond yields and the overall weakness of the US Dollar (USD).
…
This is a premium post.
[s2If !current_user_can(access_s2member_level4)]Please register for FREE REGISTER to read full post below containing analysis. In case of any error or you think you are not able to read the full post below, please email us at support#nehcap.com [lwa][/s2If] [s2If current_user_can(access_s2member_level1)]
- Silver (XAG) trades slightly higher amid declining US Treasury bond yields and broad US Dollar (USD) weakness.
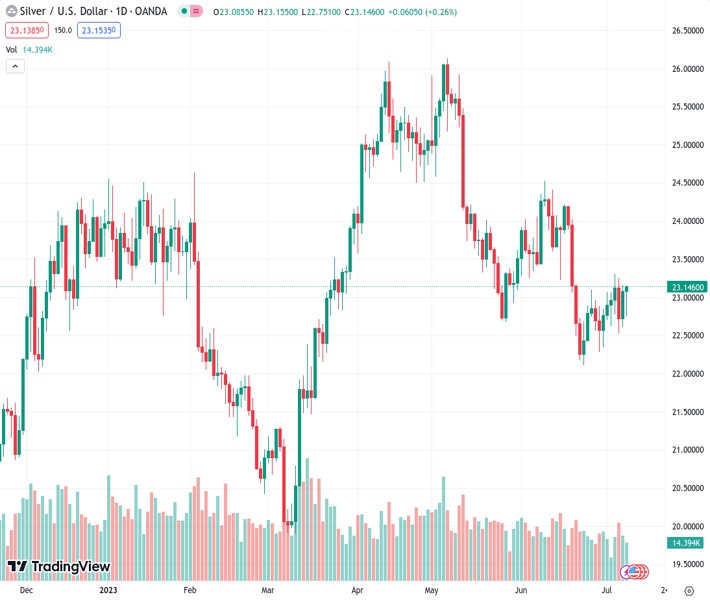
The pair currently trades last at 23.123.
The previous day high was 23.15 while the previous day low was 22.62. The daily 38.2% Fib levels comes at 22.95, expected to provide support. Similarly, the daily 61.8% fib level is at 22.82, expected to provide support.
Silver price climbs below the $23.00 figure, surpassing the 20-day Exponential Moving Average (EMA) at $23.07 on Monday, courtesy of US Bond yields falling and broad US Dollar (USD) weakness. The XAG/USD is exchanging hands at $23.12, gaining 0.32% as Wall Street’s session ends.
After sliding below the 50 and 100-day EMAs, the XAG/USD remains neutral to downward-biased, with price action hoovering around each side of the 20-day EMA and the $23.00 figure. For a bearish continuation, the XAG/USD must drop below the 200-day EMA at $22.93, opening the door for further downside, exposing as next support the June 25 daily low of $22.68.
In a decisive break, XAG/USD would slump and challenge the March 16 daily low of $22.11 before surpassing the $22.00 figure. Once cleared, the next support would be last year’s November 28 daily low of $20.87 before reaching YTD lows of $19.92.
Conversely, if XAG/USD stays afloat above $23.00, resistance levels emerge at the confluence of the 50/100-day EMAs at around $23.35/41. Once broken, the following supply area would be the $24.00 figure, followed by a June 16 daily high of $24.20.
Technical Levels: Supports and Resistances
XAGUSD currently trading at 23.14 at the time of writing. Pair opened at 23.08 and is trading with a change of 0.26 % .
| Overview | Overview.1 | |
|---|---|---|
| 0 | Today last price | 23.14 |
| 1 | Today Daily Change | 0.06 |
| 2 | Today Daily Change % | 0.26 |
| 3 | Today daily open | 23.08 |
The pair is trading below its 20 Daily moving average @ 23.14, below its 50 Daily moving average @ 23.74 , below its 100 Daily moving average @ 23.4 and above its 200 Daily moving average @ 22.68
| Trends | Trends.1 | |
|---|---|---|
| 0 | Daily SMA20 | 23.14 |
| 1 | Daily SMA50 | 23.74 |
| 2 | Daily SMA100 | 23.40 |
| 3 | Daily SMA200 | 22.68 |
The previous day high was 23.15 while the previous day low was 22.62. The daily 38.2% Fib levels comes at 22.95, expected to provide support. Similarly, the daily 61.8% fib level is at 22.82, expected to provide support.
Note the levels of interest below:
- Pivot support is noted at 22.74, 22.41, 22.21
- Pivot resistance is noted at 23.28, 23.49, 23.82
| Levels | Levels.1 |
|---|---|
| Previous Daily High | 23.15 |
| Previous Daily Low | 22.62 |
| Previous Weekly High | 23.31 |
| Previous Weekly Low | 22.52 |
| Previous Monthly High | 24.53 |
| Previous Monthly Low | 22.11 |
| Daily Fibonacci 38.2% | 22.95 |
| Daily Fibonacci 61.8% | 22.82 |
| Daily Pivot Point S1 | 22.74 |
| Daily Pivot Point S2 | 22.41 |
| Daily Pivot Point S3 | 22.21 |
| Daily Pivot Point R1 | 23.28 |
| Daily Pivot Point R2 | 23.49 |
| Daily Pivot Point R3 | 23.82 |
[/s2If]
Download Nehcap EAWe have two EAs that are operational on our LIVE accounts.
- EA-FIX: Check out the details here. Download EA-FIX . EA-FIX is a non-grid HFT scalper.
- EA-GROWTH: High quality low dd EA using trend grids. Download EA_GROWTHJoin Our Telegram Group
")


