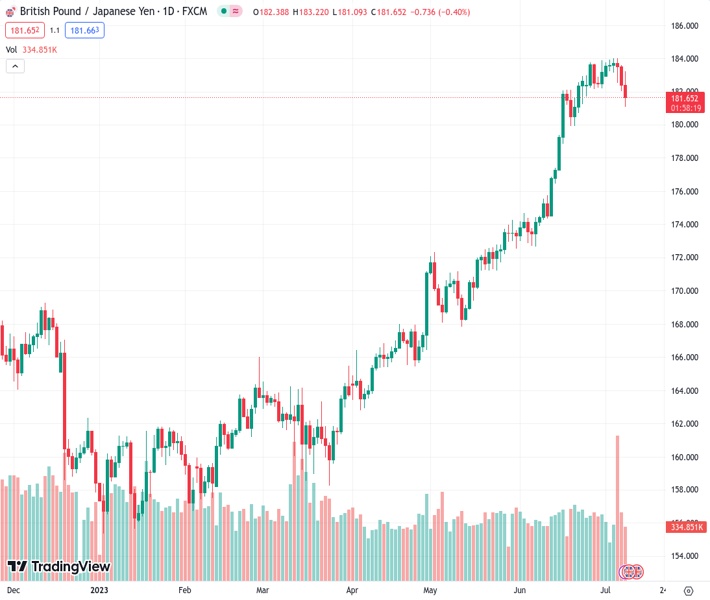
The GBPJPY pair, currently at 181.683, has experienced three consecutive days of declines and dropped to a low point of 181.10, which is lower than the 20-day simple moving average.
…
This is a premium post.
[s2If !current_user_can(access_s2member_level4)]Please register for FREE REGISTER to read full post below containing analysis. In case of any error or you think you are not able to read the full post below, please email us at support#nehcap.com [lwa][/s2If] [s2If current_user_can(access_s2member_level1)]
- The GBP/JPY cross tallies a third-consecutive day of losses falling to a low of 181.10, below the 20-day SMA.
The pair currently trades last at 181.683.
The previous day high was 183.6 while the previous day low was 182.02. The daily 38.2% Fib levels comes at 182.62, expected to provide resistance. Similarly, the daily 61.8% fib level is at 183.0, expected to provide resistance.
The GBP/JPY lost ground at the start of the week and currently stands around 181.60. Andrew Bailey’s, Governor of the Bank of England (BoE), hawkish remarks somewhat boosted the GBP while the JPY gained interest in rising Japanese bond yields.
On Monday, Bailey commented that inflation is “unacceptably high”, far from their 2% target, but confirmed that the Monetary Policy Committee expects headline inflation to drop significantly this year. In addition, he commented that he doesn’t know when rates will start to come down and that the committee is closely monitoring the labour market. That being said, Tuesday’s Claimant Count and Earnings data will be crucial.
On the other hand, Japanese yields continue to rise after strong Labor Cash Earnings data released last Friday in Japan, suggesting that markets may expect the Bank of Japan to pivot from its dovish stance to a more aggressive one. However, BoJ’s officials may need to gather more data so Machinery Orders and Producer Price Index data, to be released on Wednesday, will be closely monitored.
The daily chart suggests a bearish outlook for the short term. The Relative Strength Index (RSI) printed a steep negative slope, and the Moving Average Convergence Divergence printed higher red bars indicating a growing bearish momentum.
Support Levels: 180.10, 179.50 and 17900.
Resistance Levels: 182.70, 183.00,184.00.
Technical Levels: Supports and Resistances
GBPJPY currently trading at 181.65 at the time of writing. Pair opened at 182.49 and is trading with a change of -0.46 % .
| Overview | Overview.1 | |
|---|---|---|
| 0 | Today last price | 181.65 |
| 1 | Today Daily Change | -0.84 |
| 2 | Today Daily Change % | -0.46 |
| 3 | Today daily open | 182.49 |
The pair remains strongly bullish on the daily timeframe. It trades above its 20 SMA @ 181.51, 50 SMA 175.76, 100 SMA @ 169.84 and 200 SMA @ 166.72.
| Trends | Trends.1 | |
|---|---|---|
| 0 | Daily SMA20 | 181.51 |
| 1 | Daily SMA50 | 175.76 |
| 2 | Daily SMA100 | 169.84 |
| 3 | Daily SMA200 | 166.72 |
The previous day high was 183.6 while the previous day low was 182.02. The daily 38.2% Fib levels comes at 182.62, expected to provide resistance. Similarly, the daily 61.8% fib level is at 183.0, expected to provide resistance.
Note the levels of interest below:
- Pivot support is noted at 181.81, 181.12, 180.23
- Pivot resistance is noted at 183.39, 184.28, 184.97
| Levels | Levels.1 |
|---|---|
| Previous Daily High | 183.60 |
| Previous Daily Low | 182.02 |
| Previous Weekly High | 184.02 |
| Previous Weekly Low | 182.02 |
| Previous Monthly High | 183.88 |
| Previous Monthly Low | 172.67 |
| Daily Fibonacci 38.2% | 182.62 |
| Daily Fibonacci 61.8% | 183.00 |
| Daily Pivot Point S1 | 181.81 |
| Daily Pivot Point S2 | 181.12 |
| Daily Pivot Point S3 | 180.23 |
| Daily Pivot Point R1 | 183.39 |
| Daily Pivot Point R2 | 184.28 |
| Daily Pivot Point R3 | 184.97 |
[/s2If]
Download Nehcap EAWe have two EAs that are operational on our LIVE accounts.
- EA-FIX: Check out the details here. Download EA-FIX . EA-FIX is a non-grid HFT scalper.
- EA-GROWTH: High quality low dd EA using trend grids. Download EA_GROWTHJoin Our Telegram Group
")


