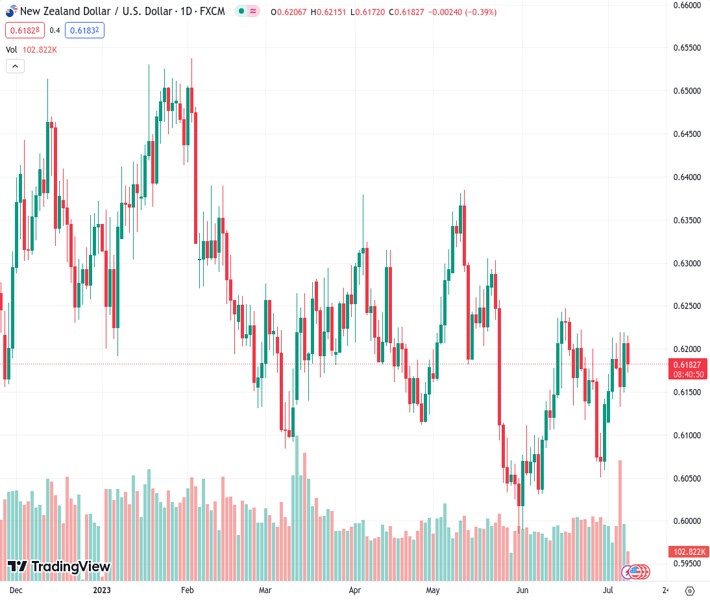
The currency pair NZDUSD at a price of 0.61834 is moving back and forth within the range of the previous day as attention turns to the policy of the Reserve Bank of New Zealand (RBNZ).
…
This is a premium post.
[s2If !current_user_can(access_s2member_level4)]Please register for FREE REGISTER to read full post below containing analysis. In case of any error or you think you are not able to read the full post below, please email us at support#nehcap.com [lwa][/s2If] [s2If current_user_can(access_s2member_level1)]
- NZD/USD is oscillating inside the previous day’s range as the focus shifts to RBNZ policy.
The pair currently trades last at 0.61834.
The previous day high was 0.6221 while the previous day low was 0.6153. The daily 38.2% Fib levels comes at 0.6195, expected to provide resistance. Similarly, the daily 61.8% fib level is at 0.6179, expected to provide support.
The NZD/USD pair is displaying topsy-turvy moves below the round-level resistance of 0.6200 in the European session. The Kiwi asset has turned choppy as investors are awaiting the interest rate decision by the Reserve Bank of New Zealand (RBNZ), which is scheduled for Wednesday at 2:00 GMT.
S&P500 futures have recovered its entire losses posted in Asia, portraying recovery in the risk appetite of the market participants. The US Dollar Index (DXY) has rebounded briskly to near 102.45. The USD Index is struggling to find strength despite rising wage pressures and sustainability in labor market conditions.
Meanwhile, RBNZ Governor Adrian Orr will likely keep interest rates unchanged at 5.50%, marking an end to its 20-month-long hiking cycle, as reported by Reuters to avoid further calamity in economic prospects. Investors should note that the New Zealand economy has already entered into a recession.
NZD/USD is forming an Inverted Head and Shoulder chart pattern on a two-hour scale, which indicates a wide consolidation. A breakout of the neckline plotted from June 22 high around 0.6220 will result in a bullish reversal. The 50-period Exponential Moving Average (EMA) at 0.6179 is providing cushion to the New Zealand Dollar bulls.
The Relative Strength Index (RSI) (14) is oscillating in the 40.00-60.00, which indicates a sideways performance.
Going forward, a decisive break above June 22 high around 0.6220 will drive the asset towards June 14 high at 0.6236 followed by May 17 high at 0.6274.
Alternatively, a downside move below June 23 low at 0.6116 will expose the asset June 05 low at 0.6041. A slippage below the latter would expose the asset to psychological support at 0.6000.
Technical Levels: Supports and Resistances
NZDUSD currently trading at 0.6186 at the time of writing. Pair opened at 0.6199 and is trading with a change of -0.21 % .
| Overview | Overview.1 | |
|---|---|---|
| 0 | Today last price | 0.6186 |
| 1 | Today Daily Change | -0.0013 |
| 2 | Today Daily Change % | -0.2100 |
| 3 | Today daily open | 0.6199 |
The pair is trading above its 20 Daily moving average @ 0.6163, above its 50 Daily moving average @ 0.6169 , below its 100 Daily moving average @ 0.6189 and above its 200 Daily moving average @ 0.6175
| Trends | Trends.1 | |
|---|---|---|
| 0 | Daily SMA20 | 0.6163 |
| 1 | Daily SMA50 | 0.6169 |
| 2 | Daily SMA100 | 0.6189 |
| 3 | Daily SMA200 | 0.6175 |
The previous day high was 0.6221 while the previous day low was 0.6153. The daily 38.2% Fib levels comes at 0.6195, expected to provide resistance. Similarly, the daily 61.8% fib level is at 0.6179, expected to provide support.
Note the levels of interest below:
- Pivot support is noted at 0.6161, 0.6123, 0.6093
- Pivot resistance is noted at 0.6229, 0.6259, 0.6297
| Levels | Levels.1 |
|---|---|
| Previous Daily High | 0.6221 |
| Previous Daily Low | 0.6153 |
| Previous Weekly High | 0.6221 |
| Previous Weekly Low | 0.6124 |
| Previous Monthly High | 0.6250 |
| Previous Monthly Low | 0.5990 |
| Daily Fibonacci 38.2% | 0.6195 |
| Daily Fibonacci 61.8% | 0.6179 |
| Daily Pivot Point S1 | 0.6161 |
| Daily Pivot Point S2 | 0.6123 |
| Daily Pivot Point S3 | 0.6093 |
| Daily Pivot Point R1 | 0.6229 |
| Daily Pivot Point R2 | 0.6259 |
| Daily Pivot Point R3 | 0.6297 |
[/s2If]
Download Nehcap EAWe have two EAs that are operational on our LIVE accounts.
- EA-FIX: Check out the details here. Download EA-FIX . EA-FIX is a non-grid HFT scalper.
- EA-GROWTH: High quality low dd EA using trend grids. Download EA_GROWTHJoin Our Telegram Group
")


