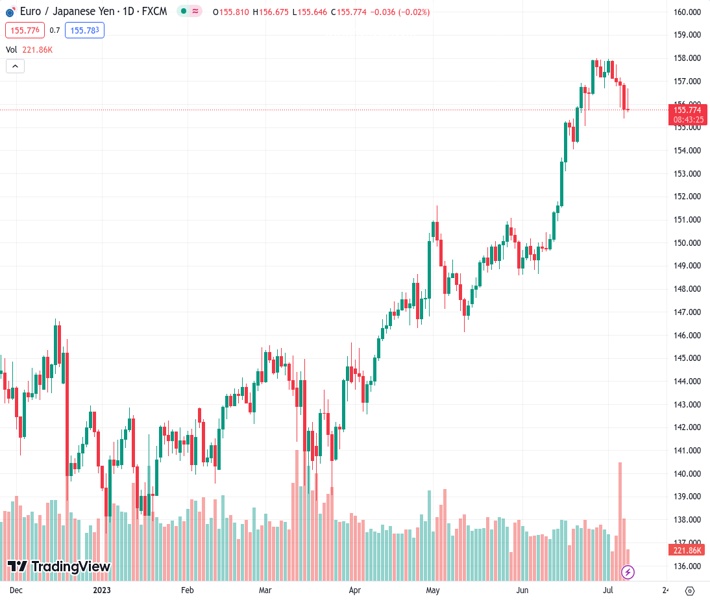
The EURJPY currency pair, currently trading at 155.770, was unable to continue its upward movement above the 156.70 level, following a rebound earlier in the day.
…
This is a premium post.
[s2If !current_user_can(access_s2member_level4)]Please register for FREE REGISTER to read full post below containing analysis. In case of any error or you think you are not able to read the full post below, please email us at support#nehcap.com [lwa][/s2If] [s2If current_user_can(access_s2member_level1)]
- EUR/JPY fails to extend the daily rebound north of 156.70.
The pair currently trades last at 155.770.
The previous day high was 156.93 while the previous day low was 155.38. The daily 38.2% Fib levels comes at 155.98, expected to provide resistance. Similarly, the daily 61.8% fib level is at 156.34, expected to provide resistance.
EUR/JPY could not sustain the earlier move to the 156.70 area and slipped back to the sub-156.00 region at the beginning of the week.
In the meantime, the cross maintains its rejection from last week’s YTD tops near the 158.00 area. Against this backdrop, further pullbacks should not be ruled out for the time being. That said, the door remains open for the cross to challenge the weekly low at 154.04 (June 20).
So far, further upside looks favoured while the cross trades above the 200-day SMA, today at 145.64.
Technical Levels: Supports and Resistances
EURJPY currently trading at 155.69 at the time of writing. Pair opened at 155.88 and is trading with a change of -0.12 % .
| Overview | Overview.1 | |
|---|---|---|
| 0 | Today last price | 155.69 |
| 1 | Today Daily Change | 103.00 |
| 2 | Today Daily Change % | -0.12 |
| 3 | Today daily open | 155.88 |
The pair remains strongly bullish on the daily timeframe. It trades above its 20 SMA @ 155.63, 50 SMA 151.77, 100 SMA @ 148.14 and 200 SMA @ 145.61.
| Trends | Trends.1 | |
|---|---|---|
| 0 | Daily SMA20 | 155.63 |
| 1 | Daily SMA50 | 151.77 |
| 2 | Daily SMA100 | 148.14 |
| 3 | Daily SMA200 | 145.61 |
The previous day high was 156.93 while the previous day low was 155.38. The daily 38.2% Fib levels comes at 155.98, expected to provide resistance. Similarly, the daily 61.8% fib level is at 156.34, expected to provide resistance.
Note the levels of interest below:
- Pivot support is noted at 155.2, 154.52, 153.65
- Pivot resistance is noted at 156.75, 157.61, 158.3
| Levels | Levels.1 |
|---|---|
| Previous Daily High | 156.93 |
| Previous Daily Low | 155.38 |
| Previous Weekly High | 157.96 |
| Previous Weekly Low | 155.38 |
| Previous Monthly High | 158.00 |
| Previous Monthly Low | 148.62 |
| Daily Fibonacci 38.2% | 155.98 |
| Daily Fibonacci 61.8% | 156.34 |
| Daily Pivot Point S1 | 155.20 |
| Daily Pivot Point S2 | 154.52 |
| Daily Pivot Point S3 | 153.65 |
| Daily Pivot Point R1 | 156.75 |
| Daily Pivot Point R2 | 157.61 |
| Daily Pivot Point R3 | 158.30 |
[/s2If]
Download Nehcap EAWe have two EAs that are operational on our LIVE accounts.
- EA-FIX: Check out the details here. Download EA-FIX . EA-FIX is a non-grid HFT scalper.
- EA-GROWTH: High quality low dd EA using trend grids. Download EA_GROWTHJoin Our Telegram Group
")


