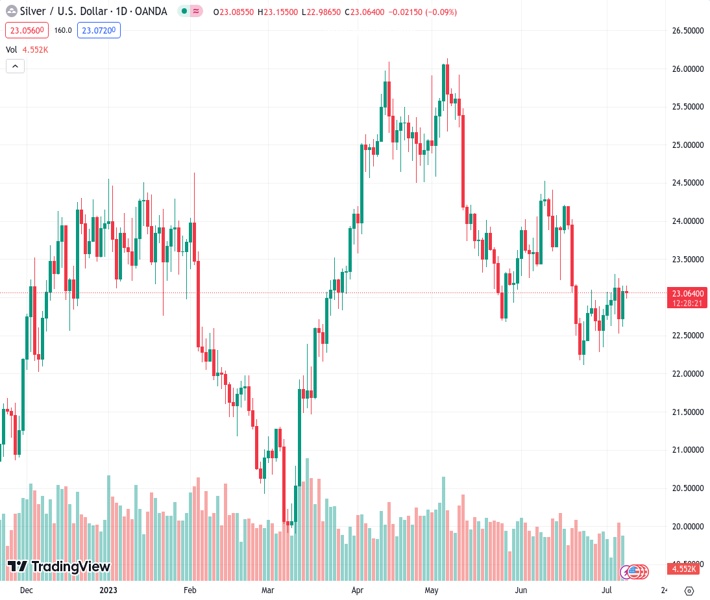
Silver is trading within a small range above the $23.00 level on Monday.
…
This is a premium post.
[s2If !current_user_can(access_s2member_level4)]Please register for FREE REGISTER to read full post below containing analysis. In case of any error or you think you are not able to read the full post below, please email us at support#nehcap.com [lwa][/s2If] [s2If current_user_can(access_s2member_level1)]
- Silver oscillates in a narrow trading range above the $23.00 mark on Monday.
The pair currently trades last at 23.069.
The previous day high was 23.15 while the previous day low was 22.62. The daily 38.2% Fib levels comes at 22.95, expected to provide support. Similarly, the daily 61.8% fib level is at 22.82, expected to provide support.
Silver kicks off the new week on a subdued note, albeit manages to hold its neck above the $23.00 round-figure mark through the early European session. The mixed technical setup, meanwhile, warrants some caution before placing aggressive directional bets.
The recent recovery from the vicinity of the $22.00 mark, or the multi-month low touched in June, has been along an upward-sloping channel. Furthermore, last week’s pullback from the $23.30 confluence – comprising the 50% Fibonacci retracement level of the downfall from the June peak and the 200-period Simple Moving Average (SMA) on the 4-hour chart – stalled near the lower end of the said channel. Moreover, positive oscillators on hourly charts favour bullish traders.
That said, technical indicators on the daily chart are yet to confirm a positive outlook. Hence, any subsequent move up might continue to face some resistance near the $23.30 confluence region. This is closely followed by the ascending trend-channel resistance, currently around the $23.45 region. A sustained strength beyond will confirm a positive breakout and lift the XAG/USD beyond the 61.8% Fibo. resistance near the $23.60 region, toward reclaiming the $24.00 mark.
The positive momentum could get extended further towards the $24.20-$24.25 intermediate barrier, above which the XAG/USD could climb back to the June monthly swing high, around the $24.55 region.
On the flip side, weakness back below the $23.00 mark, representing the 38.2% Fibo., is more likely to attract some buying and remain limited near the $22.65-$22.70 area, or the 23.6% Fibo. level. The latter should act as a pivotal point, which if broken could make the XAG/USD vulnerable to slide back towards the $22.mark. Some follow-through selling should pave the way for fall towards the $21.70-$21.65 zone en route to the $21.25 support and the $21.00 mark.
Technical Levels: Supports and Resistances
XAGUSD currently trading at 23.09 at the time of writing. Pair opened at 23.08 and is trading with a change of 0.04 % .
| Overview | Overview.1 | |
|---|---|---|
| 0 | Today last price | 23.09 |
| 1 | Today Daily Change | 0.01 |
| 2 | Today Daily Change % | 0.04 |
| 3 | Today daily open | 23.08 |
The pair is trading below its 20 Daily moving average @ 23.14, below its 50 Daily moving average @ 23.74 , below its 100 Daily moving average @ 23.4 and above its 200 Daily moving average @ 22.68
| Trends | Trends.1 | |
|---|---|---|
| 0 | Daily SMA20 | 23.14 |
| 1 | Daily SMA50 | 23.74 |
| 2 | Daily SMA100 | 23.40 |
| 3 | Daily SMA200 | 22.68 |
The previous day high was 23.15 while the previous day low was 22.62. The daily 38.2% Fib levels comes at 22.95, expected to provide support. Similarly, the daily 61.8% fib level is at 22.82, expected to provide support.
Note the levels of interest below:
- Pivot support is noted at 22.74, 22.41, 22.21
- Pivot resistance is noted at 23.28, 23.49, 23.82
| Levels | Levels.1 |
|---|---|
| Previous Daily High | 23.15 |
| Previous Daily Low | 22.62 |
| Previous Weekly High | 23.31 |
| Previous Weekly Low | 22.52 |
| Previous Monthly High | 24.53 |
| Previous Monthly Low | 22.11 |
| Daily Fibonacci 38.2% | 22.95 |
| Daily Fibonacci 61.8% | 22.82 |
| Daily Pivot Point S1 | 22.74 |
| Daily Pivot Point S2 | 22.41 |
| Daily Pivot Point S3 | 22.21 |
| Daily Pivot Point R1 | 23.28 |
| Daily Pivot Point R2 | 23.49 |
| Daily Pivot Point R3 | 23.82 |
[/s2If]
Download Nehcap EAWe have two EAs that are operational on our LIVE accounts.
- EA-FIX: Check out the details here. Download EA-FIX . EA-FIX is a non-grid HFT scalper.
- EA-GROWTH: High quality low dd EA using trend grids. Download EA_GROWTHJoin Our Telegram Group
")


