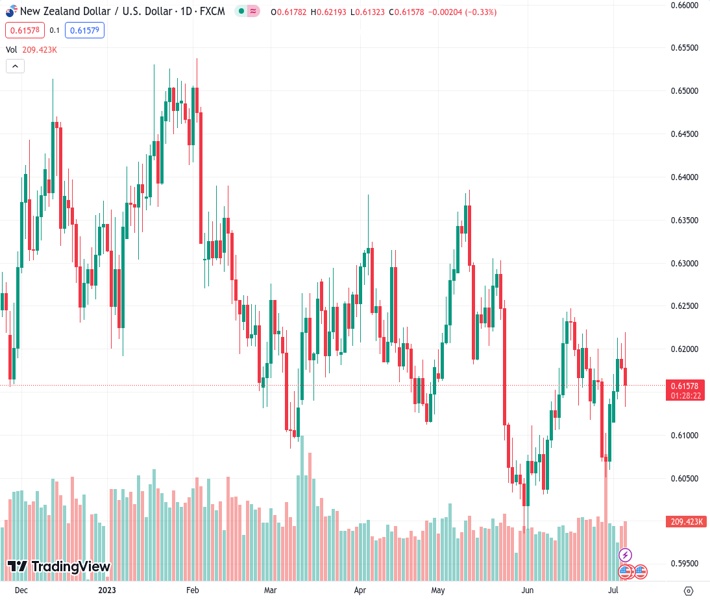
After reaching a peak of 0.6218, the NZDUSD currency pair declined to 0.6155 as buyers faced difficulty in building up strength.
…
This is a premium post.
[s2If !current_user_can(access_s2member_level4)]Please register for FREE REGISTER to read full post below containing analysis. In case of any error or you think you are not able to read the full post below, please email us at support#nehcap.com [lwa][/s2If] [s2If current_user_can(access_s2member_level1)]
- After jumping to a high of 0.6218, the NZD/USD retreated to 0.6155 as bulls struggle to gain momentum.
The pair currently trades last at 0.61584.
The previous day high was 0.6208 while the previous day low was 0.6175. The daily 38.2% Fib levels comes at 0.6188, expected to provide resistance. Similarly, the daily 61.8% fib level is at 0.6195, expected to provide resistance.
The NZD/USD pared daily gains and fell towards the 0.6155 area as expectations of further tightening by the Federal Reserve (Fed) underpined the USD. In that sense, the hot ADP figures and strong Service sector data from the US favored a more aggressive stance by the Fed.
The latest Employment Change report from Automatic Data Processing, Inc. revealed that the US economy added 497K new jobs in June, surpassing expectations of 228K and showing an increase from the previous month’s figure of 278K. In addition, the Institute Supply Management (ISM) reported that its Service PMI came in at 53.9 vs the 51 expected and accelerated from its previous figure of 50.3.
The release of the data caused a significant surge in US Treasury yields. The 2-year bond yield reached its highest level since 2007, rising to 5.08%. Likewise, the 5-year and 10-year rates increased to 4.40% and 4.03%, respectively, showing gains of over 2.50%. This spike in yields contributed to a recovery of the US Dollar, as reflected in the DXY Index. After hitting a daily low of 102.87, which aligned with its 20-day Simple Moving Average (SMA), the index rebounded to 103.25, although it remains in negative territory.
On Friday, investors will eye the release of the Nonfarm Payrolls (NFP) report for June in the US anticipated to show a decline to 225K from the previous figure of 339K.
On New Zealand’s side, the gloomy economic outlook means the Kiwi is losing interest. United Overseas Bank (UOB) said the economy has entered a technical recession as the Gross Domestic Product (GDP) contracted by 0.1% QoQ in the first quarter of 2023, significantly lower than the Reserve Bank of New Zealand (RBNZ) expectations. Its worth noting that in Q4 of 2022, a 0.7% contraction was recorded, so consecutive GDP contractions is considered an indication of a technical recession.
The technical outlook for the NZD/USD, according to the daily price chart, is neutral with a slightly bearish tone, with technical indicators somewhat flat in negative territory. The 20, 100 and 200-day SMA converge towards the 0.6200 area still suggesting that the pair is waiting for a fundamental catalyst to define the short-term trajectory.
Support Levels to watch: 0.61350, 0.6100,0.6090.
Resistance Levels to watch: 0.6160 (20-day SMA), 0.6170 (200-day SMA), 0.6190 (100-day SMA).
Technical Levels: Supports and Resistances
NZDUSD currently trading at 0.6159 at the time of writing. Pair opened at 0.6179 and is trading with a change of -0.32 % .
| Overview | Overview.1 | |
|---|---|---|
| 0 | Today last price | 0.6159 |
| 1 | Today Daily Change | -0.0020 |
| 2 | Today Daily Change % | -0.3200 |
| 3 | Today daily open | 0.6179 |
The pair is trading above its 20 Daily moving average @ 0.6157, below its 50 Daily moving average @ 0.6169 , below its 100 Daily moving average @ 0.619 and below its 200 Daily moving average @ 0.6169
| Trends | Trends.1 | |
|---|---|---|
| 0 | Daily SMA20 | 0.6157 |
| 1 | Daily SMA50 | 0.6169 |
| 2 | Daily SMA100 | 0.6190 |
| 3 | Daily SMA200 | 0.6169 |
The previous day high was 0.6208 while the previous day low was 0.6175. The daily 38.2% Fib levels comes at 0.6188, expected to provide resistance. Similarly, the daily 61.8% fib level is at 0.6195, expected to provide resistance.
Note the levels of interest below:
- Pivot support is noted at 0.6167, 0.6154, 0.6134
- Pivot resistance is noted at 0.62, 0.622, 0.6233
| Levels | Levels.1 |
|---|---|
| Previous Daily High | 0.6208 |
| Previous Daily Low | 0.6175 |
| Previous Weekly High | 0.6202 |
| Previous Weekly Low | 0.6050 |
| Previous Monthly High | 0.6250 |
| Previous Monthly Low | 0.5990 |
| Daily Fibonacci 38.2% | 0.6188 |
| Daily Fibonacci 61.8% | 0.6195 |
| Daily Pivot Point S1 | 0.6167 |
| Daily Pivot Point S2 | 0.6154 |
| Daily Pivot Point S3 | 0.6134 |
| Daily Pivot Point R1 | 0.6200 |
| Daily Pivot Point R2 | 0.6220 |
| Daily Pivot Point R3 | 0.6233 |
[/s2If]
Nehcap Expert Advisor
The NEHCAP MT4 EA is high quality professional trading system geared to generate returns without using GRID or martingales. Each trade has strict risk per trade parameter. The pairs under management include EURUSD, GBPUSD, AUDCAD, AUDNZD,GBPAUD, EURAUD, EURCAD, CHFJPY and many more.
The system is trading live: LIVE ACCOUNT TRACKING
You can run it free. Apply for a free trial and track our account. Buy the system or use profit share mechanism to generate returns on your MT4.
Join Our Telegram Group
")


