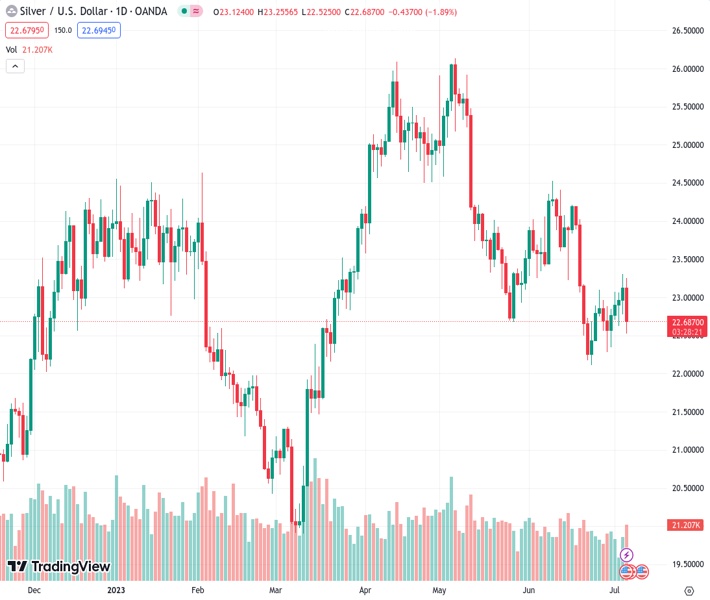
Silver prices decrease by 1.82% due to increasing US Treasury bond yields and higher chances of a Federal Reserve interest rate increase in July.
…
This is a premium post.
[s2If !current_user_can(access_s2member_level4)]Please register for FREE REGISTER to read full post below containing analysis. In case of any error or you think you are not able to read the full post below, please email us at support#nehcap.com [lwa][/s2If] [s2If current_user_can(access_s2member_level1)]
- Silver slides 1.82% as soaring US Treasury bond yields and heightened odds of a Fed rate hike in July weigh heavy.
The pair currently trades last at 22.683.
The previous day high was 23.31 while the previous day low was 22.77. The daily 38.2% Fib levels comes at 23.1, expected to provide resistance. Similarly, the daily 61.8% fib level is at 22.98, expected to provide resistance.
Silver price dropped below the $23.00 mark as US Treasury bond yield soared after the latest Fed’s minutes and a tranche of US economic data increased the odds for Fed’s July rate hike. At the time of writing, the XAG/USD is trading at $22.69, down 1.82%.
XAG/USD turned bearish during Thursday’s session. Silver’s price dropping below the 200-day Exponential Moving Average (EMA) at $22.93 opened the door for further losses, though so far failed to crack the May 26 swing low of $22.53.
If XAG/USD stays above the latter, the white metal could consolidate at around the $22.50-$22.90 range. Otherwise, Silver’s sliding below the bottom of the range will expose the June 22 swing low of $22.11 before testing $22.00. Once cleared, the XAG/USD next support will be the March 16 swing low of $21.47.
Conversely, if XAG/USD stages a comeback and reclaims the 200-day EMA, the XAG/USD’s next resistance will be the $23.00 psychological level. A breach of the latter will increase the odds for a recovery to the 20-day EMA at $23.06.
Technical Levels: Supports and Resistances
XAGUSD currently trading at 22.7 at the time of writing. Pair opened at 23.13 and is trading with a change of -1.86 % .
| Overview | Overview.1 | |
|---|---|---|
| 0 | Today last price | 22.70 |
| 1 | Today Daily Change | -0.43 |
| 2 | Today Daily Change % | -1.86 |
| 3 | Today daily open | 23.13 |
The pair is trading below its 20 Daily moving average @ 23.27, below its 50 Daily moving average @ 23.82 , below its 100 Daily moving average @ 23.38 and above its 200 Daily moving average @ 22.64
| Trends | Trends.1 | |
|---|---|---|
| 0 | Daily SMA20 | 23.27 |
| 1 | Daily SMA50 | 23.82 |
| 2 | Daily SMA100 | 23.38 |
| 3 | Daily SMA200 | 22.64 |
The previous day high was 23.31 while the previous day low was 22.77. The daily 38.2% Fib levels comes at 23.1, expected to provide resistance. Similarly, the daily 61.8% fib level is at 22.98, expected to provide resistance.
Note the levels of interest below:
- Pivot support is noted at 22.83, 22.53, 22.29
- Pivot resistance is noted at 23.37, 23.61, 23.9
| Levels | Levels.1 |
|---|---|
| Previous Daily High | 23.31 |
| Previous Daily Low | 22.77 |
| Previous Weekly High | 23.10 |
| Previous Weekly Low | 22.28 |
| Previous Monthly High | 24.53 |
| Previous Monthly Low | 22.11 |
| Daily Fibonacci 38.2% | 23.10 |
| Daily Fibonacci 61.8% | 22.98 |
| Daily Pivot Point S1 | 22.83 |
| Daily Pivot Point S2 | 22.53 |
| Daily Pivot Point S3 | 22.29 |
| Daily Pivot Point R1 | 23.37 |
| Daily Pivot Point R2 | 23.61 |
| Daily Pivot Point R3 | 23.90 |
[/s2If]
Nehcap Expert Advisor
The NEHCAP MT4 EA is high quality professional trading system geared to generate returns without using GRID or martingales. Each trade has strict risk per trade parameter. The pairs under management include EURUSD, GBPUSD, AUDCAD, AUDNZD,GBPAUD, EURAUD, EURCAD, CHFJPY and many more.
The system is trading live: LIVE ACCOUNT TRACKING
You can run it free. Apply for a free trial and track our account. Buy the system or use profit share mechanism to generate returns on your MT4.
Join Our Telegram Group
")


