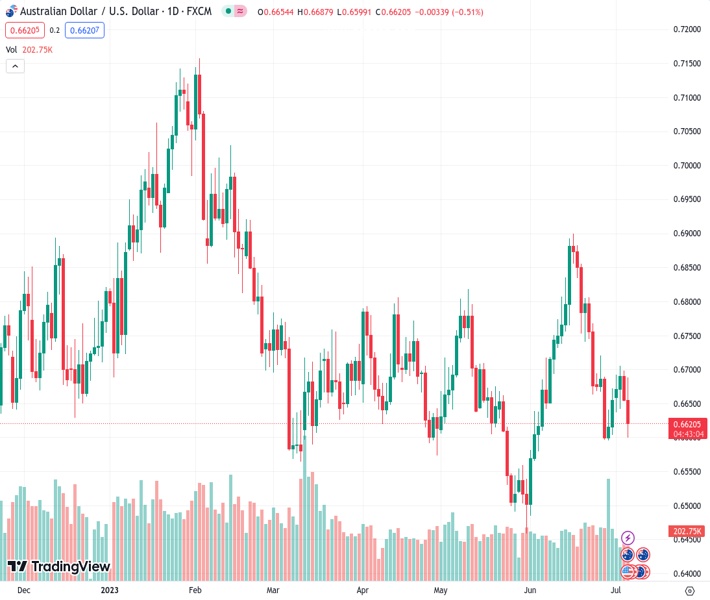
The AUD/USD pair declined to around 0.6615 level, registering a loss of over 0.50%.
…
This is a premium post.
[s2If !current_user_can(access_s2member_level4)]Please register for FREE REGISTER to read full post below containing analysis. In case of any error or you think you are not able to read the full post below, please email us at support#nehcap.com [lwa][/s2If] [s2If current_user_can(access_s2member_level1)]
- The AUD/USD retreated near the 0.6615 area posting more than 0.50% losses.
The pair currently trades last at 0.66216.
The previous day high was 0.6698 while the previous day low was 0.6653. The daily 38.2% Fib levels comes at 0.667, expected to provide resistance. Similarly, the daily 61.8% fib level is at 0.6681, expected to provide resistance.
At the time of writing the AUD/USD stands at the 0.6615 area, posting a 0.59% loss on the day. In that sense, the DXY index cleared losses as hawkish bets on the Federal Reserve (Fed) strengthened the USD via rising US yields.
The Employment Change released by Automatic Data Processing, Inc showed that generally speaking, the US economy added 497K newly employed people in June, exceeding by far the expectations of 228K and accelerating from its previous figure of 278K. On the other hand, Initial Jobless Claims for the week ending in June 30, increased as expected but came in slightly higher than the consensus at 248K vs the 245K expected. Other data showed that ISM Services PMI came in at 53.9 vs the 51 expected from its previous figure of 50.3.
As a reaction, US Treasury yields soared across the board following the data. The 2-year bond yield led the way, jumping to its highest level since 2007 at 5.08%. The 5 and 10-year rates also increased to 4.40% and 4.03%, respectively, showing more than 2.50% increases. Focus will now shift to Friday’s Non-Farm Payrolls (NFP), expected to drop 225K from the previous 339K. In that sense, the outcome could provide further volatility in the bond market and the AUD/USD price dynamics.
It’s worth mentioning that FOMC (Federal Open Market Committee) minutes revealed that some members considered appropriate hiking as a tight labor market would contribute to high inflation. That being said, a 25 basis point (bps) hike in July is priced in, while the odds of an additional hike stand around 40%.
According to the daily chart, the AUD/USD appears to be bearish in the short term. The Relative Strength Index (RSI) points south, and Moving Average Convergence Divergence (MACD) stands deep in negative territory, indicating that the bears are in command. In addition, traders should eye the 0.6700 area where the 20, 100 and 200-day Simple Moving Averages seem to be converging.
In case of more downside, support levels are seen at 0.6600, 0.6585 and 0.6550. On the flip side, the mentioned 0.6700 stands as the main resistance to recover for the bull with next targets at 0.6730 and 0.6750.
Technical Levels: Supports and Resistances
AUDUSD currently trading at 0.6618 at the time of writing. Pair opened at 0.6655 and is trading with a change of -0.56 % .
| Overview | Overview.1 | |
|---|---|---|
| 0 | Today last price | 0.6618 |
| 1 | Today Daily Change | -0.0037 |
| 2 | Today Daily Change % | -0.5600 |
| 3 | Today daily open | 0.6655 |
The pair remains strongly bearish on the daily time frame. It trades below the 20 SMA @ 0.6733, 50 SMA 0.6676, 100 SMA @ 0.6692 and 200 SMA @ 0.6695.
| Trends | Trends.1 | |
|---|---|---|
| 0 | Daily SMA20 | 0.6733 |
| 1 | Daily SMA50 | 0.6676 |
| 2 | Daily SMA100 | 0.6692 |
| 3 | Daily SMA200 | 0.6695 |
The previous day high was 0.6698 while the previous day low was 0.6653. The daily 38.2% Fib levels comes at 0.667, expected to provide resistance. Similarly, the daily 61.8% fib level is at 0.6681, expected to provide resistance.
Note the levels of interest below:
- Pivot support is noted at 0.6639, 0.6623, 0.6594
- Pivot resistance is noted at 0.6684, 0.6714, 0.673
| Levels | Levels.1 |
|---|---|
| Previous Daily High | 0.6698 |
| Previous Daily Low | 0.6653 |
| Previous Weekly High | 0.6721 |
| Previous Weekly Low | 0.6595 |
| Previous Monthly High | 0.6900 |
| Previous Monthly Low | 0.6484 |
| Daily Fibonacci 38.2% | 0.6670 |
| Daily Fibonacci 61.8% | 0.6681 |
| Daily Pivot Point S1 | 0.6639 |
| Daily Pivot Point S2 | 0.6623 |
| Daily Pivot Point S3 | 0.6594 |
| Daily Pivot Point R1 | 0.6684 |
| Daily Pivot Point R2 | 0.6714 |
| Daily Pivot Point R3 | 0.6730 |
[/s2If]
Nehcap Expert Advisor
The NEHCAP MT4 EA is high quality professional trading system geared to generate returns without using GRID or martingales. Each trade has strict risk per trade parameter. The pairs under management include EURUSD, GBPUSD, AUDCAD, AUDNZD,GBPAUD, EURAUD, EURCAD, CHFJPY and many more.
The system is trading live: LIVE ACCOUNT TRACKING
You can run it free. Apply for a free trial and track our account. Buy the system or use profit share mechanism to generate returns on your MT4.
Join Our Telegram Group
")


