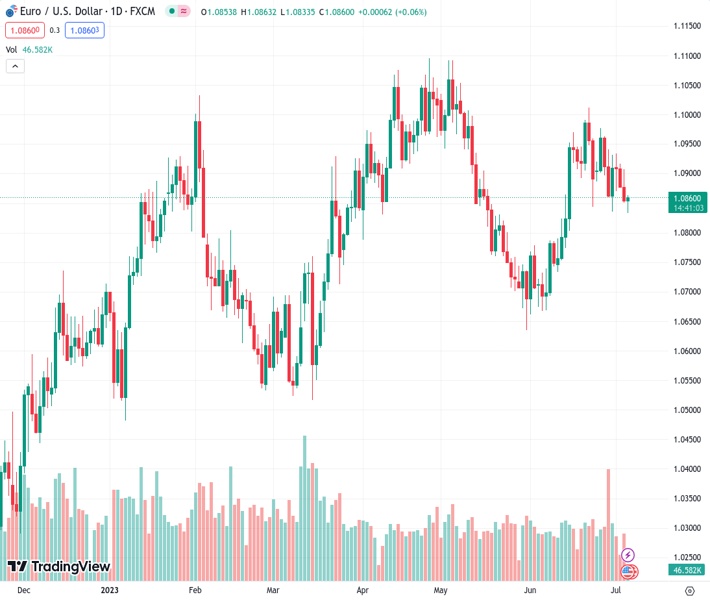
The EURUSD currency pair, currently trading at 1.08600, has gained some momentum around the 1.0834 level following positive German Factory Orders data.
…
This is a premium post.
[s2If !current_user_can(access_s2member_level4)]Please register for FREE REGISTER to read full post below containing analysis. In case of any error or you think you are not able to read the full post below, please email us at support#nehcap.com [lwa][/s2If] [s2If current_user_can(access_s2member_level1)]
- EUR/USD has picked some strength near 1.0834 after upbeat German Factory Orders data.
The pair currently trades last at 1.08600.
The previous day high was 1.0908 while the previous day low was 1.0851. The daily 38.2% Fib levels comes at 1.0873, expected to provide resistance. Similarly, the daily 61.8% fib level is at 1.0886, expected to provide resistance.
The EUR/USD pair has found an intermediate support around 1.0834 in the early European session. The shared currency pair has found support after the release of the upbeat German Factory Orders data. Monthly economic data expanded by 6.4% in May against expectations of 1.5%. In April, Factory Orders were contracted by 0.4%. On an annualized basis, Factory Orders have contracted by 4.3%.
The US Dollar Index (DXY) has corrected sharply to near 103.22 after posting a fresh four-day high at 103.40. S&P500 futures have shown decent losses in Asia, portraying negative market sentiment.
Going forward, investors will keep an eye on the United States ISM Services PMI data (June). As per the consensus, Services PMI is seen expanding to 51.0 vs. the former release of 50.3. While New Orders Index is seen declining to 53.3 against the prior release of 56.2.
EUR/USD is hovering near the horizontal support of the Descending Triangle chart pattern formed on a two-hour scale plotted from June 23 low at 1.0844. The downward-sloping trendline of the aforementioned chart pattern is placed from June 22 high at 1.1012.
The major currency pair is trading below the 50-period Exponential Moving Average (EMA) at 1.0885, which indicates that the short-term trend is bearish.
The Relative Strength Index (RSI) (14) has slipped into the bearish range of 20.00-40.00. Downside momentum would activate after a breakdown of the Descending Triangle pattern.
A decisive break below the intraday low at 1.0834 would expose the asset to June 15 low at 1.0804 followed by May 19 low at 1.0760.
On the contrary, a confident break above July 03 high at 1.0934 would send the asset towards June 27 high at 1.0977 and June 22 high at 1.1012.
Technical Levels: Supports and Resistances
EURUSD currently trading at 1.0856 at the time of writing. Pair opened at 1.0854 and is trading with a change of 0.02 % .
| Overview | Overview.1 | |
|---|---|---|
| 0 | Today last price | 1.0856 |
| 1 | Today Daily Change | 0.0002 |
| 2 | Today Daily Change % | 0.0200 |
| 3 | Today daily open | 1.0854 |
The pair is trading below its 20 Daily moving average @ 1.0884, below its 50 Daily moving average @ 1.0863 , above its 100 Daily moving average @ 1.0824 and above its 200 Daily moving average @ 1.0609
| Trends | Trends.1 | |
|---|---|---|
| 0 | Daily SMA20 | 1.0884 |
| 1 | Daily SMA50 | 1.0863 |
| 2 | Daily SMA100 | 1.0824 |
| 3 | Daily SMA200 | 1.0609 |
The previous day high was 1.0908 while the previous day low was 1.0851. The daily 38.2% Fib levels comes at 1.0873, expected to provide resistance. Similarly, the daily 61.8% fib level is at 1.0886, expected to provide resistance.
Note the levels of interest below:
- Pivot support is noted at 1.0834, 1.0814, 1.0777
- Pivot resistance is noted at 1.0891, 1.0928, 1.0948
| Levels | Levels.1 |
|---|---|
| Previous Daily High | 1.0908 |
| Previous Daily Low | 1.0851 |
| Previous Weekly High | 1.0977 |
| Previous Weekly Low | 1.0835 |
| Previous Monthly High | 1.1012 |
| Previous Monthly Low | 1.0662 |
| Daily Fibonacci 38.2% | 1.0873 |
| Daily Fibonacci 61.8% | 1.0886 |
| Daily Pivot Point S1 | 1.0834 |
| Daily Pivot Point S2 | 1.0814 |
| Daily Pivot Point S3 | 1.0777 |
| Daily Pivot Point R1 | 1.0891 |
| Daily Pivot Point R2 | 1.0928 |
| Daily Pivot Point R3 | 1.0948 |
[/s2If]
Nehcap Expert Advisor
The NEHCAP MT4 EA is high quality professional trading system geared to generate returns without using GRID or martingales. Each trade has strict risk per trade parameter. The pairs under management include EURUSD, GBPUSD, AUDCAD, AUDNZD,GBPAUD, EURAUD, EURCAD, CHFJPY and many more.
The system is trading live: LIVE ACCOUNT TRACKING
You can run it free. Apply for a free trial and track our account. Buy the system or use profit share mechanism to generate returns on your MT4.
Join Our Telegram Group
")


