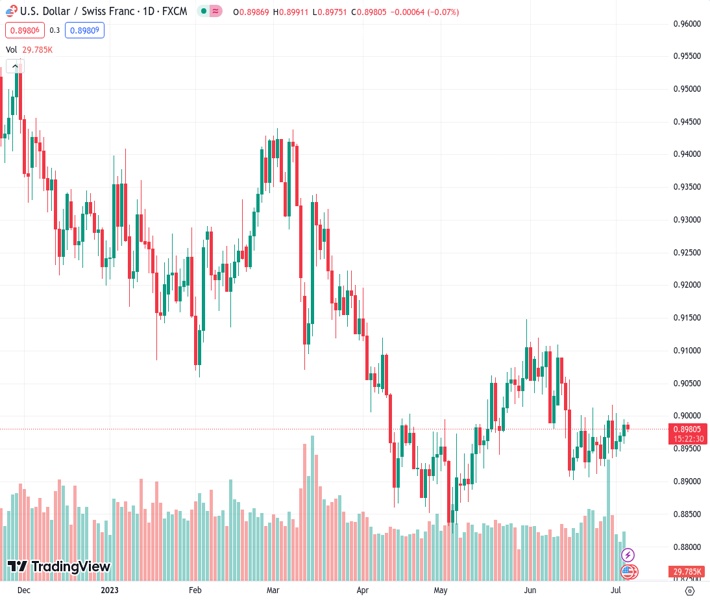
There has been a consistent increase in buying of the USDCHF currency pair at a rate of 0.89800 for the past four days, which is being supported by a slight increase in the strength of the USD.
…
This is a premium post.
[s2If !current_user_can(access_s2member_level4)]Please register for FREE REGISTER to read full post below containing analysis. In case of any error or you think you are not able to read the full post below, please email us at support#nehcap.com [lwa][/s2If] [s2If current_user_can(access_s2member_level1)]
- USD/CHF attracts buying for the fourth straight day and is supported by modest USD strength.
The pair currently trades last at 0.89800.
The previous day high was 0.8995 while the previous day low was 0.8962. The daily 38.2% Fib levels comes at 0.8982, expected to provide resistance. Similarly, the daily 61.8% fib level is at 0.8975, expected to provide support.
The USD/CHF pair trades with a positive bias for the fourth straight day on Thursday, albeit lacks follow-through and remains below the 0.9000 psychological mark through the Asian session.
The US Dollar (USD) adds to its weekly gains and climbs back closer to its highest level since June 12 touched last Friday, which, in turn, is seen as a key factor acting as a tailwind for the USD/CHF pair. The minutes from the June FOMC meeting released on Wednesday revealed that almost all members supported resuming rate hikes as inflation remains unacceptably high, reaffirming bets for a 25 bps lift-off at the upcoming FOMC meeting on July 25-26. This led to the overnight sharp rise in the US Treasury bond yields and continues to lend support to the Greenback.
The USD/CHF pair, however, still seem to struggle to capitalize on the move beyond the 50-day Simple Moving Average (SMA) and remains confined in a familiar trading range held over the past three weeks or so. A generally weaker risk tone, which tends to underpin the safe-haven Swiss Franc, holds back traders from placing aggressive bullish bets and seems to cap the upside for the major. The market sentiment remains fragile in the wake of worries over a global economic slowdown and the potential risk of a further escalation in the US-China trade conflict.
It is worth recalling that China introduced fresh export curbs on two metals – widely used in semiconductors, electric vehicles and high-tech industries – to the US. The abrupt move, which is set to take effect on August 1, might cause more disruption to global trade and hamper already weak economic conditions. This, in turn, takes its toll on the global risk sentiment and makes it prudent to wait for sustained strength and acceptance above the 0.9000 psychological mark before positioning for any further near-term appreciating move for the USD/CHF pair.
Market participants now look forward to the US economic docket, featuring the release of the ADP report on private-sector employment, the usual Weekly Initial Jobless Claims, the ISM Services PMI and JOLTS Job Openings data. Apart from this, the US bond yields, will influence the USD price dynamics, which, along with the broader risk sentiment, should provide some impetus to the USD/CHF pair. The focus, however, will remain glued to the closely-watched US monthly employment details, popularly known as the NFP report on Friday.
Technical Levels: Supports and Resistances
USDCHF currently trading at 0.8989 at the time of writing. Pair opened at 0.8987 and is trading with a change of 0.02 % .
| Overview | Overview.1 | |
|---|---|---|
| 0 | Today last price | 0.8989 |
| 1 | Today Daily Change | 0.0002 |
| 2 | Today Daily Change % | 0.0200 |
| 3 | Today daily open | 0.8987 |
The pair is trading above its 20 Daily moving average @ 0.8978, above its 50 Daily moving average @ 0.8985 , below its 100 Daily moving average @ 0.9077 and below its 200 Daily moving average @ 0.9291
| Trends | Trends.1 | |
|---|---|---|
| 0 | Daily SMA20 | 0.8978 |
| 1 | Daily SMA50 | 0.8985 |
| 2 | Daily SMA100 | 0.9077 |
| 3 | Daily SMA200 | 0.9291 |
The previous day high was 0.8995 while the previous day low was 0.8962. The daily 38.2% Fib levels comes at 0.8982, expected to provide resistance. Similarly, the daily 61.8% fib level is at 0.8975, expected to provide support.
Note the levels of interest below:
- Pivot support is noted at 0.8968, 0.8949, 0.8935
- Pivot resistance is noted at 0.9001, 0.9014, 0.9033
| Levels | Levels.1 |
|---|---|
| Previous Daily High | 0.8995 |
| Previous Daily Low | 0.8962 |
| Previous Weekly High | 0.9017 |
| Previous Weekly Low | 0.8912 |
| Previous Monthly High | 0.9120 |
| Previous Monthly Low | 0.8902 |
| Daily Fibonacci 38.2% | 0.8982 |
| Daily Fibonacci 61.8% | 0.8975 |
| Daily Pivot Point S1 | 0.8968 |
| Daily Pivot Point S2 | 0.8949 |
| Daily Pivot Point S3 | 0.8935 |
| Daily Pivot Point R1 | 0.9001 |
| Daily Pivot Point R2 | 0.9014 |
| Daily Pivot Point R3 | 0.9033 |
[/s2If]
Nehcap Expert Advisor
The NEHCAP MT4 EA is high quality professional trading system geared to generate returns without using GRID or martingales. Each trade has strict risk per trade parameter. The pairs under management include EURUSD, GBPUSD, AUDCAD, AUDNZD,GBPAUD, EURAUD, EURCAD, CHFJPY and many more.
The system is trading live: LIVE ACCOUNT TRACKING
You can run it free. Apply for a free trial and track our account. Buy the system or use profit share mechanism to generate returns on your MT4.
Join Our Telegram Group
")


