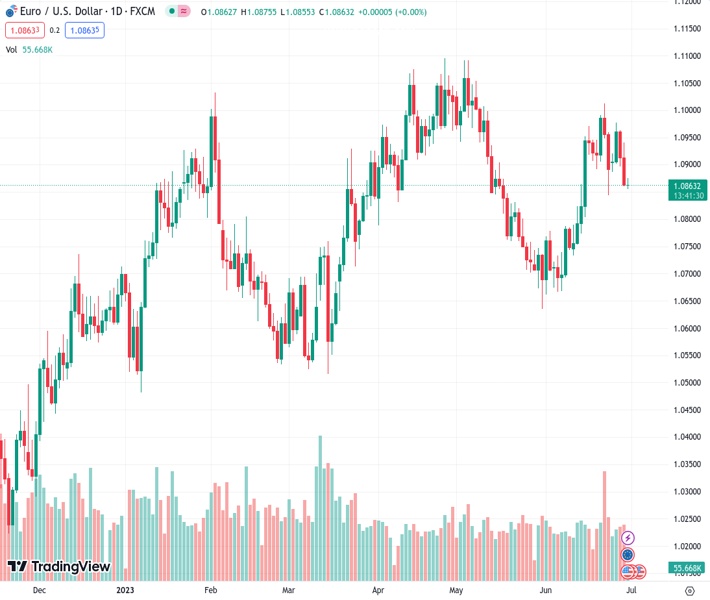
The EURUSD currency pair, currently trading at 1.08623, is experiencing a decrease in demand, leading to a new low for the week. However, this decrease in demand is relatively small.
…
This is a premium post.
[s2If !current_user_can(access_s2member_level4)]Please register for FREE REGISTER to read full post below containing analysis. In case of any error or you think you are not able to read the full post below, please email us at support#nehcap.com [lwa][/s2If] [s2If current_user_can(access_s2member_level1)]
- EUR/USD takes offers to refresh weekly low, mildly offered of late.
The pair currently trades last at 1.08623.
The previous day high was 1.0941 while the previous day low was 1.086. The daily 38.2% Fib levels comes at 1.0891, expected to provide resistance. Similarly, the daily 61.8% fib level is at 1.091, expected to provide resistance.
EUR/USD renews weekly bottom around 1.0850 as it prints a three-day downtrend despite upbeat German Retail Sales. That said, the Euro pair’s latest fall could also be linked to the US Dollar’s broad recovery amid the early hours of Friday’s European session.
German Retail Sales improved to -3.6% YoY in May versus -4.3% expected and prior readings whereas the monthly figure also rose past 0.0% expected to 0.4% figure, compared to 0.8% previous readings. However, the Import Price Index flash mixed signals as it improves on MoM to -1.4% but deteriorates to -9.1% on YoY.
It’s worth noting that the Western market’s active performance and the previous day’s hawkish comments from Fed Chair Jerome Powell, as well as from Atlanta Federal Reserve President Raphael Bostic, also seem to drown the EUR/USD bears. Additionally, upbeat prints of the US Gross Domestic Product (GDP) Annualized and the Weekly Initial Jobless Claims exert additional downside pressure on the Euro prices.
On the other hand, fears that European leaders will carve out China de-risk strategy and also prepare for the risks to the bloc emanating from Brexit also seem to weigh on the EUR/USD.
Earlier in the week, Eurozone sentiment figures deteriorated and the German inflation clues firmed but the European Central Bank (ECB) officials stays hawkish, at least for July.
Amid these plays, yields rebound and the S&P500 Futures fade the early-day gains.
Moving on, the first readings of Eurozone HICP and Consumer Price Index (CPI) inflation numbers for June will precede the US Core PCE Price Index for May to entertain the EUR/USD pair traders.
Also read: US PCE Preview: Three ways this inflation gauge impacts your income and summer plans
EUR/USD bears need validation from the 50-Exponential Moving Average (EMA) support of around 1.0850, failing to break the same could trigger a corrective bounce toward a one-week-old descending resistance line, around 1.0940 at the latest.
Technical Levels: Supports and Resistances
EURUSD currently trading at 1.0859 at the time of writing. Pair opened at 1.0868 and is trading with a change of -0.08% % .
| Overview | Overview.1 | |
|---|---|---|
| 0 | Today last price | 1.0859 |
| 1 | Today Daily Change | -0.0009 |
| 2 | Today Daily Change % | -0.08% |
| 3 | Today daily open | 1.0868 |
The pair is trading above its 20 Daily moving average @ 1.0847, below its 50 Daily moving average @ 1.0873 , above its 100 Daily moving average @ 1.0817 and above its 200 Daily moving average @ 1.0585
| Trends | Trends.1 | |
|---|---|---|
| 0 | Daily SMA20 | 1.0847 |
| 1 | Daily SMA50 | 1.0873 |
| 2 | Daily SMA100 | 1.0817 |
| 3 | Daily SMA200 | 1.0585 |
The previous day high was 1.0941 while the previous day low was 1.086. The daily 38.2% Fib levels comes at 1.0891, expected to provide resistance. Similarly, the daily 61.8% fib level is at 1.091, expected to provide resistance.
Note the levels of interest below:
- Pivot support is noted at 1.0839, 1.0809, 1.0758
- Pivot resistance is noted at 1.092, 1.0971, 1.1001
| Levels | Levels.1 |
|---|---|
| Previous Daily High | 1.0941 |
| Previous Daily Low | 1.0860 |
| Previous Weekly High | 1.1012 |
| Previous Weekly Low | 1.0844 |
| Previous Monthly High | 1.1092 |
| Previous Monthly Low | 1.0635 |
| Daily Fibonacci 38.2% | 1.0891 |
| Daily Fibonacci 61.8% | 1.0910 |
| Daily Pivot Point S1 | 1.0839 |
| Daily Pivot Point S2 | 1.0809 |
| Daily Pivot Point S3 | 1.0758 |
| Daily Pivot Point R1 | 1.0920 |
| Daily Pivot Point R2 | 1.0971 |
| Daily Pivot Point R3 | 1.1001 |
[/s2If]
Nehcap Expert Advisor
The NEHCAP MT4 EA is high quality professional trading system geared to generate returns without using GRID or martingales. Each trade has strict risk per trade parameter. The pairs under management include EURUSD, GBPUSD, AUDCAD, AUDNZD,GBPAUD, EURAUD, EURCAD, CHFJPY and many more.
The system is trading live: LIVE ACCOUNT TRACKING
You can run it free. Apply for a free trial and track our account. Buy the system or use profit share mechanism to generate returns on your MT4.
Join Our Telegram Group
")


