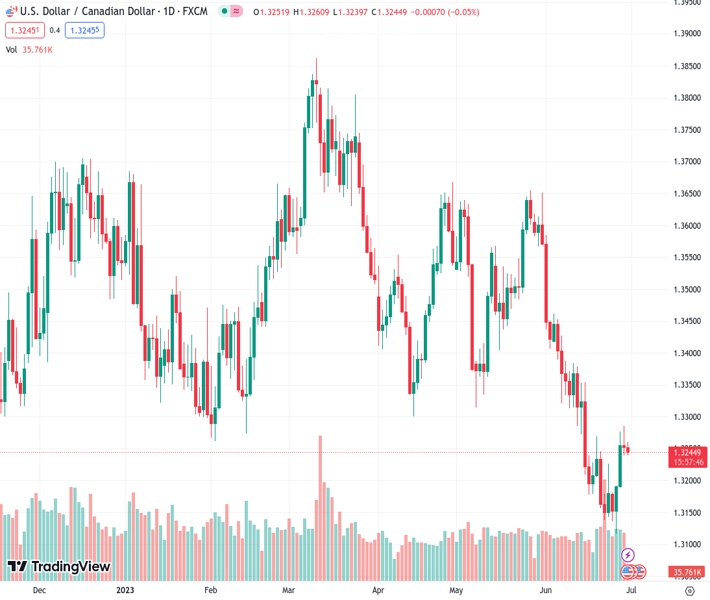
During the Asian session on Friday, the USDCAD pair continued to trade within a limited range at a rate of 1.32458.
…
This is a premium post.
[s2If !current_user_can(access_s2member_level4)]Please register for FREE REGISTER to read full post below containing analysis. In case of any error or you think you are not able to read the full post below, please email us at support#nehcap.com [lwa][/s2If] [s2If current_user_can(access_s2member_level1)]
- USD/CAD remains confined in a narrow trading range through the Asian session on Friday.
The pair currently trades last at 1.32458.
The previous day high was 1.3285 while the previous day low was 1.3239. The daily 38.2% Fib levels comes at 1.3257, expected to provide resistance. Similarly, the daily 61.8% fib level is at 1.3268, expected to provide resistance.
The USD/CAD pair struggles to gain any meaningful traction and oscillates in a narrow trading range, just below mid-1.3200s through the Asian session on Friday. Spot prices, however, manage to defend the 23.6% Fibonacci retracement level of the recent slide from the May swing high and for now, seem to have stalled the overnight retracement slide from a nearly two-week high.
Crude Oil prices consolidate the gains registered over the past two days and continues to underpin the commodity-linked Loonie. The US Dollar (USD), on the other hand, pulls back from its highest level since June 13 and turns out to be another factor acting as a headwind for the USD/CAD pair. However, concerns that a global economic downturn will dent fuel demand keep a lid on any meaningful upside for the black liquid. Apart from this, the Federal Reserve’s (Fed) hawkish outlook lends some support to the buck and the major.
It is worth recalling that the Fed earlier this month signalled that borrowing costs may still need to rise as much as 50 bps by the end of this year. Adding to this, the upbeat US macro data released on Thursday gives the Fed another reason to continue raising interest rates and reaffirmed market bets for a 25 bps lift-off at the July FOMC meeting. Furthermore, Fed Chair Jerome Powell reiterated earlier this week that two rate increases are likely this year and also said that he does not see inflation coming down to the Fed’s 2% target until 2025.
Hence, the market focus will remain glued to the US Core PCE Price Index – the Fed’s preferred inflation gauge – due later during the early North American session. The crucial data will play a key role in influencing expectations about the US central bank’s future rate-hike path. This, in turn, should drive the USD demand and determine the next leg of a directional move for the USD/CAD pair. Hence, it will be prudent to wait for strong follow-through buying before positioning for an extension of this week’s goodish rebound from the YTD low.
Technical Levels: Supports and Resistances
USDCAD currently trading at 1.3244 at the time of writing. Pair opened at 1.3252 and is trading with a change of -0.06 % .
| Overview | Overview.1 | |
|---|---|---|
| 0 | Today last price | 1.3244 |
| 1 | Today Daily Change | -0.0008 |
| 2 | Today Daily Change % | -0.0600 |
| 3 | Today daily open | 1.3252 |
The pair remains strongly bearish on the daily time frame. It trades below the 20 SMA @ 1.3279, 50 SMA 1.3428, 100 SMA @ 1.3496 and 200 SMA @ 1.3516.
| Trends | Trends.1 | |
|---|---|---|
| 0 | Daily SMA20 | 1.3279 |
| 1 | Daily SMA50 | 1.3428 |
| 2 | Daily SMA100 | 1.3496 |
| 3 | Daily SMA200 | 1.3516 |
The previous day high was 1.3285 while the previous day low was 1.3239. The daily 38.2% Fib levels comes at 1.3257, expected to provide resistance. Similarly, the daily 61.8% fib level is at 1.3268, expected to provide resistance.
Note the levels of interest below:
- Pivot support is noted at 1.3232, 1.3212, 1.3186
- Pivot resistance is noted at 1.3279, 1.3305, 1.3325
| Levels | Levels.1 |
|---|---|
| Previous Daily High | 1.3285 |
| Previous Daily Low | 1.3239 |
| Previous Weekly High | 1.3270 |
| Previous Weekly Low | 1.3139 |
| Previous Monthly High | 1.3655 |
| Previous Monthly Low | 1.3315 |
| Daily Fibonacci 38.2% | 1.3257 |
| Daily Fibonacci 61.8% | 1.3268 |
| Daily Pivot Point S1 | 1.3232 |
| Daily Pivot Point S2 | 1.3212 |
| Daily Pivot Point S3 | 1.3186 |
| Daily Pivot Point R1 | 1.3279 |
| Daily Pivot Point R2 | 1.3305 |
| Daily Pivot Point R3 | 1.3325 |
[/s2If]
Nehcap Expert Advisor
The NEHCAP MT4 EA is high quality professional trading system geared to generate returns without using GRID or martingales. Each trade has strict risk per trade parameter. The pairs under management include EURUSD, GBPUSD, AUDCAD, AUDNZD,GBPAUD, EURAUD, EURCAD, CHFJPY and many more.
The system is trading live: LIVE ACCOUNT TRACKING
You can run it free. Apply for a free trial and track our account. Buy the system or use profit share mechanism to generate returns on your MT4.
Join Our Telegram Group
")


