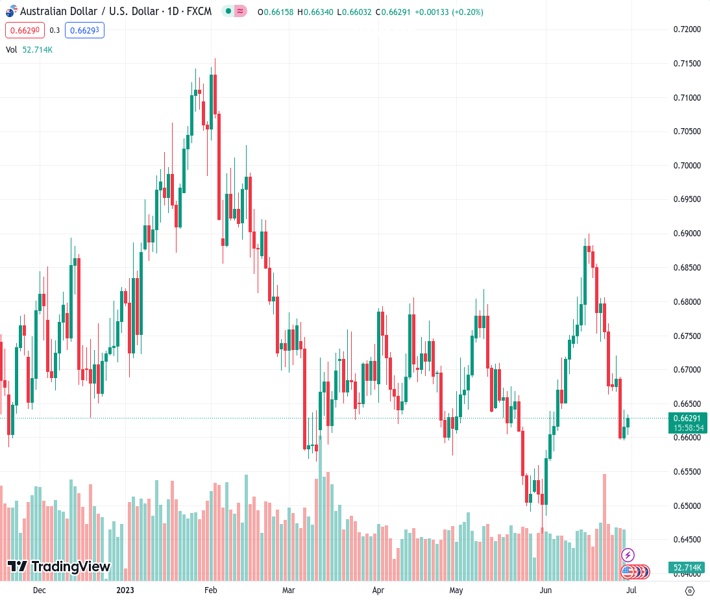
The AUDUSD pair is currently holding slight gains as it remains within a bearish channel that has been in place for the past two weeks. According to the perspective of Nehcap, they anticipate further downside movement.
…
This is a premium post.
[s2If !current_user_can(access_s2member_level4)]Please register for FREE REGISTER to read full post below containing analysis. In case of any error or you think you are not able to read the full post below, please email us at support#nehcap.com [lwa][/s2If] [s2If current_user_can(access_s2member_level1)]
- AUD/USD clings to mild gains within two-week-old bearish channel.
The pair currently trades last at 0.66272.
The previous day high was 0.6641 while the previous day low was 0.6595. The daily 38.2% Fib levels comes at 0.6623, expected to provide support. Similarly, the daily 61.8% fib level is at 0.6613, expected to provide support.
AUD/USD picks up bids to extend the previous day’s corrective bounce off a three-week low to 0.6630 heading into Friday’s European session. In doing so, the Aussie pair cheers the US Dollar’s retreat while staying within a fortnight-old descending trend channel.
Not only the bearish chart formation but the quote’s sustained trading below the 200-SMA also keeps the pair sellers hopeful.
However, the recent bullish MACD signals and the RSI (14) rebound from the oversold territory underpin the hopes of the AUD/USD pair’s further recovery.
Though the upside remains elusive until staying below the stated channel’s top line, close to 0.6650 by the press time.
Even if the AUD/USD pair manages to cross the 0.6650 hurdle, the 200-SMA level of 0.6685 and the 0.6700 round figure can check the bulls before giving them control.
It should be observed that the weekly high of 0.6720 will act as the final defense of the AUD/USD bears.
On the flip side, ascending trend line from Wednesday, around the 0.6600 round figure, restricts the short-term AUD/USD downside.
Following that, the bearish channel’s bottom line and the 78.6% Fibonacci retracement level of the pair’s late May to mid-June upside, near 0.6560-55, will be crucial to watch for further guidance.
Trend: Further downside expected
Technical Levels: Supports and Resistances
AUDUSD currently trading at 0.6629 at the time of writing. Pair opened at 0.6616 and is trading with a change of 0.20% % .
| Overview | Overview.1 | |
|---|---|---|
| 0 | Today last price | 0.6629 |
| 1 | Today Daily Change | 0.0013 |
| 2 | Today Daily Change % | 0.20% |
| 3 | Today daily open | 0.6616 |
The pair remains strongly bearish on the daily time frame. It trades below the 20 SMA @ 0.6726, 50 SMA 0.6674, 100 SMA @ 0.6703 and 200 SMA @ 0.6692.
| Trends | Trends.1 | |
|---|---|---|
| 0 | Daily SMA20 | 0.6726 |
| 1 | Daily SMA50 | 0.6674 |
| 2 | Daily SMA100 | 0.6703 |
| 3 | Daily SMA200 | 0.6692 |
The previous day high was 0.6641 while the previous day low was 0.6595. The daily 38.2% Fib levels comes at 0.6623, expected to provide support. Similarly, the daily 61.8% fib level is at 0.6613, expected to provide support.
Note the levels of interest below:
- Pivot support is noted at 0.6594, 0.6572, 0.6549
- Pivot resistance is noted at 0.664, 0.6663, 0.6685
| Levels | Levels.1 |
|---|---|
| Previous Daily High | 0.6641 |
| Previous Daily Low | 0.6595 |
| Previous Weekly High | 0.6886 |
| Previous Weekly Low | 0.6663 |
| Previous Monthly High | 0.6818 |
| Previous Monthly Low | 0.6458 |
| Daily Fibonacci 38.2% | 0.6623 |
| Daily Fibonacci 61.8% | 0.6613 |
| Daily Pivot Point S1 | 0.6594 |
| Daily Pivot Point S2 | 0.6572 |
| Daily Pivot Point S3 | 0.6549 |
| Daily Pivot Point R1 | 0.6640 |
| Daily Pivot Point R2 | 0.6663 |
| Daily Pivot Point R3 | 0.6685 |
[/s2If]
Nehcap Expert Advisor
The NEHCAP MT4 EA is high quality professional trading system geared to generate returns without using GRID or martingales. Each trade has strict risk per trade parameter. The pairs under management include EURUSD, GBPUSD, AUDCAD, AUDNZD,GBPAUD, EURAUD, EURCAD, CHFJPY and many more.
The system is trading live: LIVE ACCOUNT TRACKING
You can run it free. Apply for a free trial and track our account. Buy the system or use profit share mechanism to generate returns on your MT4.
Join Our Telegram Group
")


