The USDINR pair experiences a slight decrease on Friday, falling further after a previous decrease from its highest point in the past two weeks.
…
This is a premium post.
[s2If !current_user_can(access_s2member_level4)]Please register for FREE REGISTER to read full post below containing analysis. In case of any error or you think you are not able to read the full post below, please email us at support#nehcap.com [lwa][/s2If] [s2If current_user_can(access_s2member_level1)]
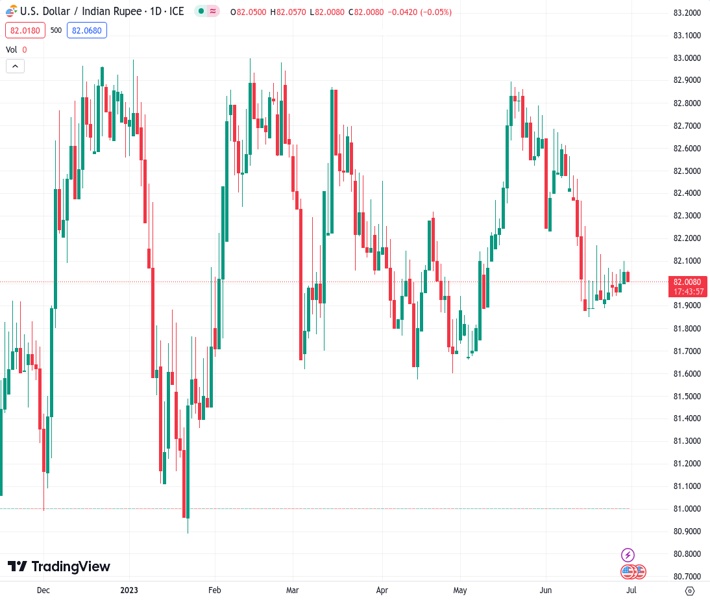
- USD/INR edges lower on Friday and extends the overnight pullback from a two-week high.
The pair currently trades last at 82.0250.
The previous day high was 82.259 while the previous day low was 81.996. The daily 38.2% Fib levels comes at 82.1585, expected to provide resistance. Similarly, the daily 61.8% fib level is at 82.0965, expected to provide resistance.
The USD/INR pair edges lower during the Asian session on Friday and moves further away from a two-week high, around the 82.25 region touched the previous day. Spot prices, however, manage to hold above the 82.00 mark and remain confined in a familiar trading band held over the past two weeks or so.
Against the backdrop of the recent pullback from the vicinity of the 83.00 mark, the recent range-bound price action might still be categorized as a bearish consolidation phase. Moreover, the overnight failure to find acceptance above a technically significant 200-day Simple Moving Average (SMA) and the subsequent slide suggests that the path of least resistance for the USD/INR pair is to the downside.
Furthermore, technical indicators on the daily chart – though have been recovering from lower levels – are still holding in the bearish territory. That said, it will still be prudent to wait for a sustained break below the trading range support, around the 81.85 area, before placing fresh bearish bets around the USD/INR pair and positioning for a slide to the 81.50 en route to sub-81.00 levels or the monthly swing low.
On the flip side, some follow-through buying beyond the overnight swing high, around the 82.25 region, could be seen as a positive breakout through the short-term trading range and pave the way for additional gains. The subsequent move up has the potential to lift the USD/INR pair back towards the 82.70-82.75 intermediate hurdle, above which bulls are likely to make a fresh attempt to conquer the 83.00 mark.
Technical Levels: Supports and Resistances
USDINR currently trading at 82.0415 at the time of writing. Pair opened at 82.0734 and is trading with a change of -0.04 % .
| Overview | Overview.1 | |
|---|---|---|
| 0 | Today last price | 82.0415 |
| 1 | Today Daily Change | -0.0319 |
| 2 | Today Daily Change % | -0.0400 |
| 3 | Today daily open | 82.0734 |
The pair remains strongly bearish on the daily time frame. It trades below the 20 SMA @ 82.1688, 50 SMA 82.2012, 100 SMA @ 82.2586 and 200 SMA @ 82.1472.
| Trends | Trends.1 | |
|---|---|---|
| 0 | Daily SMA20 | 82.1688 |
| 1 | Daily SMA50 | 82.2012 |
| 2 | Daily SMA100 | 82.2586 |
| 3 | Daily SMA200 | 82.1472 |
The previous day high was 82.259 while the previous day low was 81.996. The daily 38.2% Fib levels comes at 82.1585, expected to provide resistance. Similarly, the daily 61.8% fib level is at 82.0965, expected to provide resistance.
Note the levels of interest below:
- Pivot support is noted at 81.9599, 81.8465, 81.6969
- Pivot resistance is noted at 82.2229, 82.3725, 82.4859
| Levels | Levels.1 |
|---|---|
| Previous Daily High | 82.2590 |
| Previous Daily Low | 81.9960 |
| Previous Weekly High | 82.1725 |
| Previous Weekly Low | 81.8845 |
| Previous Monthly High | 82.9810 |
| Previous Monthly Low | 81.6435 |
| Daily Fibonacci 38.2% | 82.1585 |
| Daily Fibonacci 61.8% | 82.0965 |
| Daily Pivot Point S1 | 81.9599 |
| Daily Pivot Point S2 | 81.8465 |
| Daily Pivot Point S3 | 81.6969 |
| Daily Pivot Point R1 | 82.2229 |
| Daily Pivot Point R2 | 82.3725 |
| Daily Pivot Point R3 | 82.4859 |
[/s2If]
Nehcap Expert Advisor
The NEHCAP MT4 EA is high quality professional trading system geared to generate returns without using GRID or martingales. Each trade has strict risk per trade parameter. The pairs under management include EURUSD, GBPUSD, AUDCAD, AUDNZD,GBPAUD, EURAUD, EURCAD, CHFJPY and many more.
The system is trading live: LIVE ACCOUNT TRACKING
You can run it free. Apply for a free trial and track our account. Buy the system or use profit share mechanism to generate returns on your MT4.
Join Our Telegram Group
")


