EURUSD is facing difficulty in making significant progress on Friday and is remaining close to its lowest point of the week.
…
This is a premium post.
[s2If !current_user_can(access_s2member_level4)]Please register for FREE REGISTER to read full post below containing analysis. In case of any error or you think you are not able to read the full post below, please email us at support#nehcap.com [lwa][/s2If] [s2If current_user_can(access_s2member_level1)]
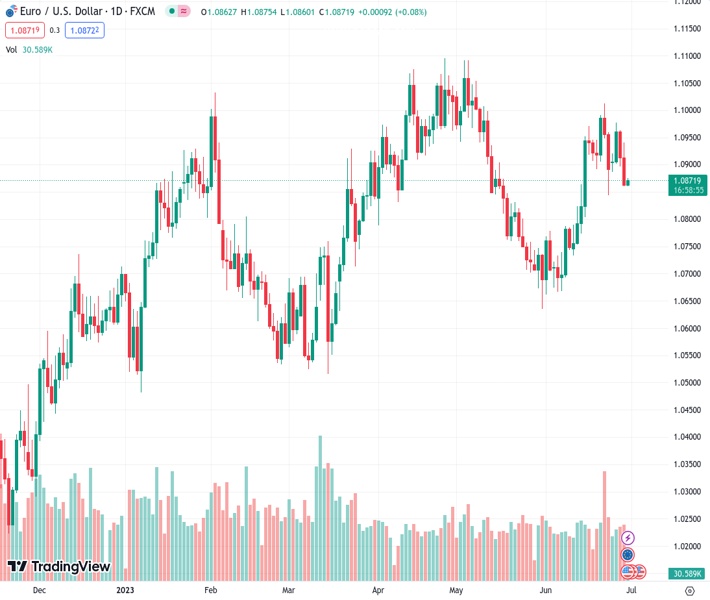
- EUR/USD struggles to gain any meaningful traction on Friday and hangs near the weekly low.
The pair currently trades last at 1.08719.
The previous day high was 1.0941 while the previous day low was 1.086. The daily 38.2% Fib levels comes at 1.0891, expected to provide resistance. Similarly, the daily 61.8% fib level is at 1.091, expected to provide resistance.
The EUR/USD pair lacks any firm intraday direction and oscillates in a narrow trading band around the 1.0860-1.0865 area or the weekly low through the Asian session on Friday. Traders now seem to have moved to the sidelines ahead of the crucial inflation figures from the Euro Zone and the United States (US) before placing fresh directional bets.
The flash version of the Euro Zone Harmonized Index of Consumer Prices (HICP) is scheduled for release at 09:00 GMT and is anticipated to decelerate to the 5.6% YoY rate in June from 6.1% in the previous month. The Core CPI, however, is expected to rise from 5.3% to 5.5% and reaffirm bets for an interest rate hike at the next European Central Bank (ECB) meeting on July 27. In the meantime, worries about economic headwinds stemmign from rapidly rising borrowing costs act as a headwind for the shared currency and cap the EUR/USD pair.
Later during the early North American session, traders will take cues from the US Personal Consumption Expenditures (PCE) Price Index. The data will influence market expectations about the Federal Reserve’s future rate-hike path, which, in turn, will drive the US Dollar (USD) demand and determine the near-term trajectory for the EUR/USD pair. Ahead of the key data risks, the USD takes a brief pause following a two-day strong rally to the highest level since June 13 and is seen lending some support to the EUR/USD pair, at least for the time being.
The US central bank, meanwhile, had signalled that borrowing costs may still need to rise as much as 50 bps by the end of this year and the outlook was reaffirmed by Fed Chair Jerome Powell this week. Adding to this, Thursday’s upbeat US economic data cemented expectations for a 25 bps lift-off at the July 25-26 FOMC policy meeting. This, in turn, remains supportive of elevated US Treasury bond yields, which continues to act as a tailwind for the Greenback and should contribute to keeping a lid on any meaningful upside for the EUR/USD pair.
The aforementioned fundamental backdrop seems tilted in favour of bearish traders and suggests that the path of least reisstance for spot prices is to the downside. That said, the recent two-way price moves witnessed over the past two weeks or so points to indecision among traders. This makes it prudent to wait for some follow-through selling below last week’s swing low, around the 1.0845 region, before positioning for an extension of the recent pullback from a six-week high – levels just above the 1.1000 psychological mark touched last Thursday.
Technical Levels: Supports and Resistances
EURUSD currently trading at 1.0868 at the time of writing. Pair opened at 1.0868 and is trading with a change of 0.0 % .
| Overview | Overview.1 | |
|---|---|---|
| 0 | Today last price | 1.0868 |
| 1 | Today Daily Change | 0.0000 |
| 2 | Today Daily Change % | 0.0000 |
| 3 | Today daily open | 1.0868 |
The pair is trading above its 20 Daily moving average @ 1.0847, below its 50 Daily moving average @ 1.0873 , above its 100 Daily moving average @ 1.0817 and above its 200 Daily moving average @ 1.0585
| Trends | Trends.1 | |
|---|---|---|
| 0 | Daily SMA20 | 1.0847 |
| 1 | Daily SMA50 | 1.0873 |
| 2 | Daily SMA100 | 1.0817 |
| 3 | Daily SMA200 | 1.0585 |
The previous day high was 1.0941 while the previous day low was 1.086. The daily 38.2% Fib levels comes at 1.0891, expected to provide resistance. Similarly, the daily 61.8% fib level is at 1.091, expected to provide resistance.
Note the levels of interest below:
- Pivot support is noted at 1.0839, 1.0809, 1.0758
- Pivot resistance is noted at 1.092, 1.0971, 1.1001
| Levels | Levels.1 |
|---|---|
| Previous Daily High | 1.0941 |
| Previous Daily Low | 1.0860 |
| Previous Weekly High | 1.1012 |
| Previous Weekly Low | 1.0844 |
| Previous Monthly High | 1.1092 |
| Previous Monthly Low | 1.0635 |
| Daily Fibonacci 38.2% | 1.0891 |
| Daily Fibonacci 61.8% | 1.0910 |
| Daily Pivot Point S1 | 1.0839 |
| Daily Pivot Point S2 | 1.0809 |
| Daily Pivot Point S3 | 1.0758 |
| Daily Pivot Point R1 | 1.0920 |
| Daily Pivot Point R2 | 1.0971 |
| Daily Pivot Point R3 | 1.1001 |
[/s2If]
Nehcap Expert Advisor
The NEHCAP MT4 EA is high quality professional trading system geared to generate returns without using GRID or martingales. Each trade has strict risk per trade parameter. The pairs under management include EURUSD, GBPUSD, AUDCAD, AUDNZD,GBPAUD, EURAUD, EURCAD, CHFJPY and many more.
The system is trading live: LIVE ACCOUNT TRACKING
You can run it free. Apply for a free trial and track our account. Buy the system or use profit share mechanism to generate returns on your MT4.
Join Our Telegram Group
")


