Some buyers show interest in purchasing GBPUSD at a rate of 1.26182 on Friday, as the subdued movement of the USD helps to strengthen its support.
…
This is a premium post.
[s2If !current_user_can(access_s2member_level4)]Please register for FREE REGISTER to read full post below containing analysis. In case of any error or you think you are not able to read the full post below, please email us at support#nehcap.com [lwa][/s2If] [s2If current_user_can(access_s2member_level1)]
- GBP/USD attracts some buyers on Friday and draws support from subdued USD price action.
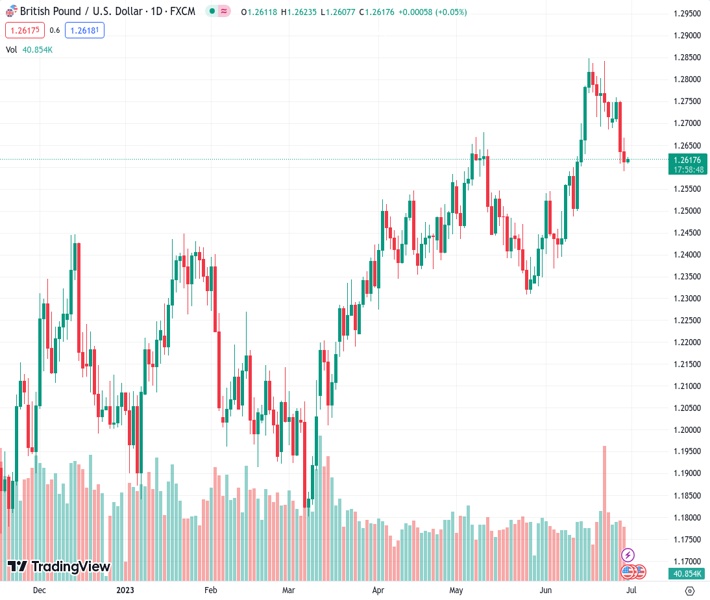
The pair currently trades last at 1.26182.
The previous day high was 1.2667 while the previous day low was 1.2591. The daily 38.2% Fib levels comes at 1.262, expected to provide resistance. Similarly, the daily 61.8% fib level is at 1.2638, expected to provide resistance.
The GBP/USD pair edges higher during the Asian session on Friday and recovers further from over a two-week low, around the 1.2590 region touched the previous day. Spot prices currently trade around the 1.2620 area, up just over 0.05% for the day, and for now, seem to have snapped a two-day losing streak, though any meaningful upside still seems elusive.
The US Dollar (USD) pauses after registering strong gains over the past two days and rising to its highest level since June 13, which, in turn, is seen as a key factor lending some support to the GBP/USD pair. That said, firming expectations for more interest rate hikes by the Federal Reserve (Fed) should continue to act as a tailwind for the Greenback. In fact, Fed Chair Jerome Powell reiterated this week that the US central bank could hike rates at least two more times this year.
Adding to this, the upbeat US macro data released on Thursday reaffirmed bets for a 25 bps lift-off at the next FOMC policy meeting on July 25-26. This, in turn, remains supportive of elevated US Treasury bond yields and favours the USD bulls. Apart from this, growing concerns that the UK economy is heading for recession, especially after a surprise 50 bps rate hike by the Bank of England (BoE) last Thursday, might further contribute to capping gains for the GBP/USD pair.
Traders might also refrain from placing aggressive bets and prefer to wait on the sidelines ahead of Friday’s release of the US PCE Price Index, due later during the early North American session. The core reading, which is the Fed’s preferred inflation gauge, will play a key role in influencing market expectations about the future rate-hike path. This, in turn, will drive the USD demand and help investors to determine the next leg of a directional move for the GBP/USD pair.
Hence, it will be prudent to wait for strong follow-through buying before confirming that the recent corrective decline from the vicinity of mid-1.2800s, or over a one-year high touched earlier this month, has run its course. Nevertheless, the GBP/USD pair remains on track to end in the red for the second successive week, though has managed to hold comfortably above technically significant Simple Moving Averages (50, 100 and 200-day SMAs).
Technical Levels: Supports and Resistances
GBPUSD currently trading at 1.2622 at the time of writing. Pair opened at 1.2615 and is trading with a change of 0.06 % .
| Overview | Overview.1 | |
|---|---|---|
| 0 | Today last price | 1.2622 |
| 1 | Today Daily Change | 0.0007 |
| 2 | Today Daily Change % | 0.0600 |
| 3 | Today daily open | 1.2615 |
The pair is trading below its 20 Daily moving average @ 1.2639, above its 50 Daily moving average @ 1.2544 , above its 100 Daily moving average @ 1.2373 and above its 200 Daily moving average @ 1.2103
| Trends | Trends.1 | |
|---|---|---|
| 0 | Daily SMA20 | 1.2639 |
| 1 | Daily SMA50 | 1.2544 |
| 2 | Daily SMA100 | 1.2373 |
| 3 | Daily SMA200 | 1.2103 |
The previous day high was 1.2667 while the previous day low was 1.2591. The daily 38.2% Fib levels comes at 1.262, expected to provide resistance. Similarly, the daily 61.8% fib level is at 1.2638, expected to provide resistance.
Note the levels of interest below:
- Pivot support is noted at 1.2582, 1.2549, 1.2506
- Pivot resistance is noted at 1.2657, 1.27, 1.2733
| Levels | Levels.1 |
|---|---|
| Previous Daily High | 1.2667 |
| Previous Daily Low | 1.2591 |
| Previous Weekly High | 1.2845 |
| Previous Weekly Low | 1.2685 |
| Previous Monthly High | 1.2680 |
| Previous Monthly Low | 1.2308 |
| Daily Fibonacci 38.2% | 1.2620 |
| Daily Fibonacci 61.8% | 1.2638 |
| Daily Pivot Point S1 | 1.2582 |
| Daily Pivot Point S2 | 1.2549 |
| Daily Pivot Point S3 | 1.2506 |
| Daily Pivot Point R1 | 1.2657 |
| Daily Pivot Point R2 | 1.2700 |
| Daily Pivot Point R3 | 1.2733 |
[/s2If]
Nehcap Expert Advisor
The NEHCAP MT4 EA is high quality professional trading system geared to generate returns without using GRID or martingales. Each trade has strict risk per trade parameter. The pairs under management include EURUSD, GBPUSD, AUDCAD, AUDNZD,GBPAUD, EURAUD, EURCAD, CHFJPY and many more.
The system is trading live: LIVE ACCOUNT TRACKING
You can run it free. Apply for a free trial and track our account. Buy the system or use profit share mechanism to generate returns on your MT4.
Join Our Telegram Group
")


