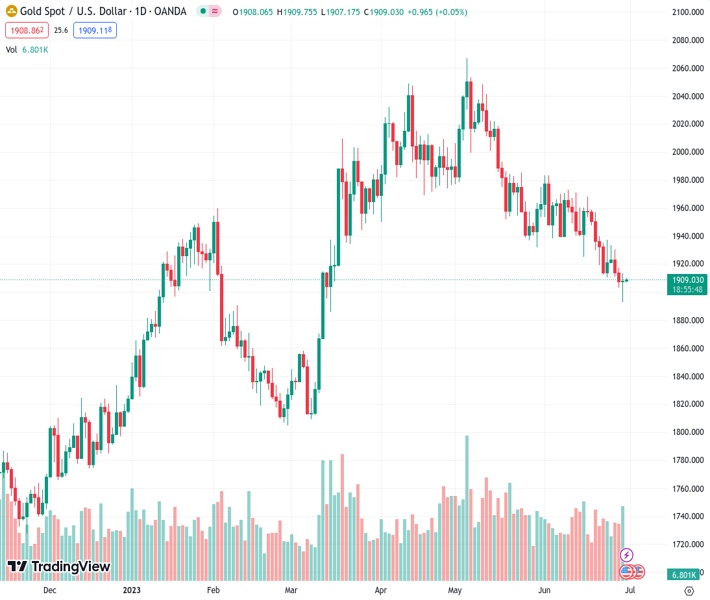
The price of gold, represented as XAUUSD at 1,908.87, is unable to entice any buyers or capitalize on the slight rise it experienced overnight after reaching a low point that had not been seen in several months.
…
This is a premium post.
[s2If !current_user_can(access_s2member_level4)]Please register for FREE REGISTER to read full post below containing analysis. In case of any error or you think you are not able to read the full post below, please email us at support#nehcap.com [lwa][/s2If] [s2If current_user_can(access_s2member_level1)]
- Gold price fails to attract any buyers or build on the overnight bounce from a multi-month low.
The pair currently trades last at 1908.87.
The previous day high was 1913.17 while the previous day low was 1893.01. The daily 38.2% Fib levels comes at 1905.47, expected to provide support. Similarly, the daily 61.8% fib level is at 1900.71, expected to provide support.
Gold price struggles to capitalize on the overnight bounce from the $1,893-$1,892 area, or its lowest level since mid-March and oscillates in a narrow trading band during the Asian session on Friday. The XAU/USD currently trades below the $1,910 level, nearly unchanged for the day as traders keenly await the release of the key inflation data from the United States (US) before placing fresh directional bets.
The US Personal Consumption Expenditures (PCE) Price Index, especially the core reading, is the Federal Reserve’s (Fed) preferred inflation gauge and might influence expectations about the future rate-hike path. This, in turn, will play a key role in influencing the US Dollar (USD) price dynamics and help determine the next leg of a directional move for the Gold price. In the meantime, the USD is seen consolidating its gains recorded over the past two trading days, to the highest level since June 13, and lends some support to the US Dollar-denominated XAU/USD.
That said, a more hawkish outlook by major central banks continues to act as a headwind for the non-yielding Gold price and keeps a lid on any meaningful recovery. In fact, the European Central Bank (ECB) President Christine Lagarde, speaking at the Sintra central banking event in Portugal, said that inflation in the Eurozone is too high and is set to remain so for too long, lifting bets for a ninth consecutive lift-off in July. Adding to this, the Bank of England (BoE) Governor Andrew Bailey hinted that rates could remain at peak levels for longer than traders currently expect.
Fed Chair Jerome Powell, meanwhile, reiterated that two rate increases are likely this year and said that he does not see inflation coming down to the Fed’s 2% target until 2025. This, along with the upbeat US macro data released on Thursday, reaffirmed expectations for a 25 basis points (bps) rate hike at the next Federal Open Market Committee (FOMC) policy meeting on July 25-26. This, in turn, remains supportive of elevated US Treasury bond yields and favours the USD bulls, suggesting that the path of least resistance for Gold price is to the downside.
From a technical perspective, the $1,900 round figure, followed by the overnight swing low, around the $1,893-$1,892 region, now seems to act as immediate support levels. Some follow-through selling will reaffirm the negative outlook and make the Gold price vulnerable to extend the downward trajectory towards challenging the very important 200-day Simple Moving Average (SMA), currently pegged around the $1,840 region.
On the flip side, any positive move beyond the $1,913 area, or the overnight swing high, might now confront resistance near the $1,924-$1,925 region ahead of the $1,936 area. This is closely followed by the 100-day SMA, around the $1,942 zone. A sustained strength above might trigger a short-covering rally towards the $1,962-$1,964 hurdle en route to the $1,970-$1,972 supply zone. Some follow-through buying should allow Gold price to reclaim the $2,000 psychological mark and climb further towards the $2,010-$2,012 hurdle.
Technical Levels: Supports and Resistances
XAUUSD currently trading at 1907.96 at the time of writing. Pair opened at 1908.2 and is trading with a change of -0.01 % .
| Overview | Overview.1 | |
|---|---|---|
| 0 | Today last price | 1907.96 |
| 1 | Today Daily Change | -0.24 |
| 2 | Today Daily Change % | -0.01 |
| 3 | Today daily open | 1908.20 |
The pair is trading below its 20 Daily moving average @ 1940.32, below its 50 Daily moving average @ 1970.36 , below its 100 Daily moving average @ 1943.91 and above its 200 Daily moving average @ 1858.19
| Trends | Trends.1 | |
|---|---|---|
| 0 | Daily SMA20 | 1940.32 |
| 1 | Daily SMA50 | 1970.36 |
| 2 | Daily SMA100 | 1943.91 |
| 3 | Daily SMA200 | 1858.19 |
The previous day high was 1913.17 while the previous day low was 1893.01. The daily 38.2% Fib levels comes at 1905.47, expected to provide support. Similarly, the daily 61.8% fib level is at 1900.71, expected to provide support.
Note the levels of interest below:
- Pivot support is noted at 1896.42, 1884.63, 1876.26
- Pivot resistance is noted at 1916.58, 1924.95, 1936.74
| Levels | Levels.1 |
|---|---|
| Previous Daily High | 1913.17 |
| Previous Daily Low | 1893.01 |
| Previous Weekly High | 1958.85 |
| Previous Weekly Low | 1910.18 |
| Previous Monthly High | 2079.76 |
| Previous Monthly Low | 1932.12 |
| Daily Fibonacci 38.2% | 1905.47 |
| Daily Fibonacci 61.8% | 1900.71 |
| Daily Pivot Point S1 | 1896.42 |
| Daily Pivot Point S2 | 1884.63 |
| Daily Pivot Point S3 | 1876.26 |
| Daily Pivot Point R1 | 1916.58 |
| Daily Pivot Point R2 | 1924.95 |
| Daily Pivot Point R3 | 1936.74 |
[/s2If]
Nehcap Expert Advisor
The NEHCAP MT4 EA is high quality professional trading system geared to generate returns without using GRID or martingales. Each trade has strict risk per trade parameter. The pairs under management include EURUSD, GBPUSD, AUDCAD, AUDNZD,GBPAUD, EURAUD, EURCAD, CHFJPY and many more.
The system is trading live: LIVE ACCOUNT TRACKING
You can run it free. Apply for a free trial and track our account. Buy the system or use profit share mechanism to generate returns on your MT4.
Join Our Telegram Group
")


