Gold price remains bearish, hovering around its lowest levels since March. It is preparing for a second consecutive weekly decline. However, the view from @nehcap suggests that any further decline is expected to be limited.
…
This is a premium post.
[s2If !current_user_can(access_s2member_level4)]Please register for FREE REGISTER to read full post below containing analysis. In case of any error or you think you are not able to read the full post below, please email us at support#nehcap.com [lwa][/s2If] [s2If current_user_can(access_s2member_level1)]
- Gold Price stays bearish near the lowest levels since March, braces for the second consecutive weekly loss.
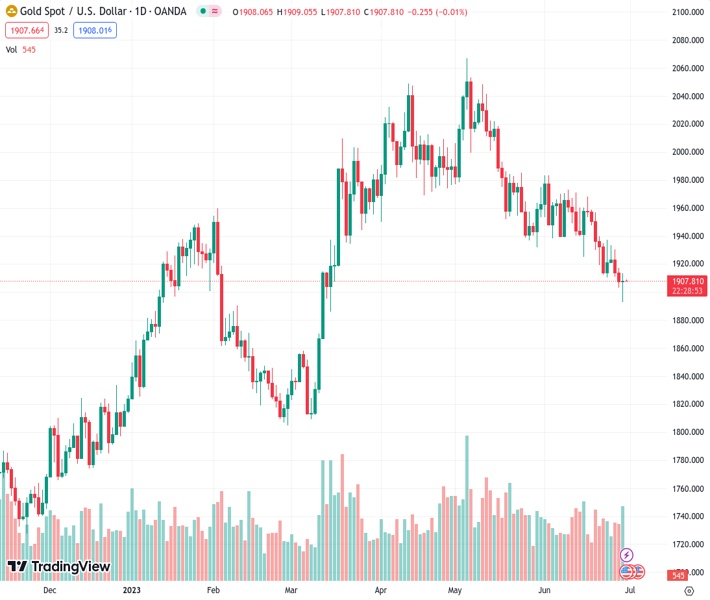
The pair currently trades last at 1907.79.
The previous day high was 1917.26 while the previous day low was 1902.91. The daily 38.2% Fib levels comes at 1908.39, expected to provide resistance. Similarly, the daily 61.8% fib level is at 1911.78, expected to provide resistance.
Gold Price (XAU/USD) licks its wounds at the lowest levels in three months, stays bearish despite late Thursday’s corrective bounce off multi-day low to around $1,908 amid the early hours of Friday’s Asian session. The XAU/USD dropped to a fresh low since March 15 before bouncing off $1,893 as strong United States data and hawkish Federal Reserve (Fed) talks joined upbeat market sentiment the previous day. That said, the quote presently pokes the key support and hence traders keep their eyes on the US Core Personal Consumption Expenditure (PCE) Price Index data, the Fed’s preferred inflation gauge, for clear directions. Also important to watch are the preliminary reading of China’s NBS Manufacturing PMI and Non-Manufacturing PMII, as well as central bankers’ speeches.
Gold Price bears the burden of the mostly firmer US data, which in turn underpins the hawkish Federal Reserve (Fed) commentary.
On Thursday, the US Gross Domestic Product (GDP) Annualized, mostly known as the Real GDP, grew at the 2.0% rate for the first quarter (Q1) of 2023 versus the 1.3% initial estimation. Further, the US Weekly Initial Jobless Claims slumped to 239K for the week ended on June 23 compared to 265K expected and revised prior. However, the Personal Consumption Expenditure (PCE) Price for Q1 2023 eased to 4.1% QoQ from 4.2% expected and prior whereas the Pending Home Sales slumped to -2.7% MoM for May compared to 0.2% expected and -0.4% prior (revised).
On the other hand, Fed Chair Jerome Powell spoke at the Fourth Conference on Financial Stability hosted by the Bank of Spain, in Madrid, while saying, “A strong majority of Fed policymakers expect two or more rate hikes by year-end.” The policymaker, however, also said, “Bank stresses that emerged in March ‘may well lead’ to a further tightening in credit conditions,” which in turn prod US Dollar bulls despite keeping them in the driver’s seat. The reason could be linked to the upbeat results of the US Banking Stress Test.
“The Fed’s ‘stress test’ exercise showed lenders, including JPMorgan Chase, Bank of America, Citigroup, Wells Fargo, Morgan Stanley and Goldman Sachs, have enough capital to weather a severe economic slump, paving the way for them to issue share buybacks and dividends,” reported Reuters.
On the contrary, Atlanta Federal Reserve President Raphael Bostic told reporters regarding future rate increases, as reported by Reuters, that he doesn’t see as much urgency to move as stated by others, including Chairman Jerome Powell. The policymaker, however, recently took a U-turn while saying, “I think it’s unambiguous that inflation has fallen considerably.”
Apart from the United States data, the European Central Bank (ECB) policymakers’ inability to convince markets of their hawkish capacity, amid looming recession fears, also seemed to have propelled the US Dollar and weighed on the Gold Price. Furthermore, Mixed headlines about the US-China ties also weighed on the XAU/USD. That said, US Treasury Secretary Janet Yellen ‘hopes’ to visit China to re-establish contacts but also showed readiness to take actions to protect national security interests even at an economic cost.
Even so, markets welcome the upbeat US data and shrug off the fears from China while taming the US Dollar gains and allowing the Gold sellers to take a breather afterward. On Thursday, Analysts at Moody’s rating agency said that the US economy can absorb the impact of China’s slower growth, which in turn allowed the US Dollar to cheer hawkish comments from Fed Chair Powell and upbeat data at home.
It should be noted that the US 10-year and two-year Treasury bond yields rallied while the US Dollar Index (DXY) also refreshed its weekly top before retreating to 103.40.
Looking ahead, China’s official Purchasing Managers’ Index (PMI) details for June and the Federal Reserve’s (Fed) favorite inflation gauge, namely the US Core Personal Consumption Expenditure (PCE) Price Index, for June and May respectively, will be in the spotlight. While China’s headline NBS Manufacturing PMI is expected to improve to 49.0 from 48.8 and the Non-Manufacturing PMI may ease to 50.8 from 54.5 prior, fears about the dragon nation’s economic weakness exert downside pressure on the Gold Price due to Beijing’s status as one of the world’s biggest XAU/USD customers.
Elsewhere, the US Core PCE Price Index is likely to remain static at 0.4% MoM and 4.7% YoY, which in turn may allow the Fed to keep its hawkish bias and exert downside pressure on the Gold Price.
Additionally important are the inflation numbers from Europe and the UK’s Gross Domestic Product (GDP) for data, not to forget central bankers’ speeches.
Gold Price broke the key support line stretched from late November 2022 the previous day but failed to offer a daily close beneath the same, around $1,908 by the press time.
Apart from the multi-month-old rising trend line, the five-month-old horizontal support zone surrounding $1,890-85 and the nearly oversold conditions of the Relative Strength Index (RSI) also challenge the Gold sellers.
However, the XAU/USD’s clear downside break of the 100-DMA and sustained adherence to the fortnight-long descending resistance line, as well as bearish signals from the Moving Average Convergence and Divergence (MACD) indicator, keep the bears hopeful.
Hence, the sellers stay in the driver’s seat unless the Gold Price crosses the immediate resistance and the 100-DMA, respectively near $1,915 and $1,945 in that order.
Even if the XAU/USD rises past $1,945, a descending trend line from June 02, close to $1,952 at the latest, will act as the final defense of the Gold bears.
On the flip side, the aforementioned support line of near $1,908 and the horizontal region near $1,890-85 restricts the immediate downside of the Gold Price.
Following that, the 200-DMA and 61.8% Fibonacci retracement of the November-May upside, near $1,858, will be in the spotlight.
Trend: Limited downside expected
Technical Levels: Supports and Resistances
XAUUSD currently trading at 1908.42 at the time of writing. Pair opened at 1907.38 and is trading with a change of 0.05% % .
| Overview | Overview.1 | |
|---|---|---|
| 0 | Today last price | 1908.42 |
| 1 | Today Daily Change | 1.04 |
| 2 | Today Daily Change % | 0.05% |
| 3 | Today daily open | 1907.38 |
The pair is trading below its 20 Daily moving average @ 1943.8, below its 50 Daily moving average @ 1972.29 , below its 100 Daily moving average @ 1943.58 and above its 200 Daily moving average @ 1857.02
| Trends | Trends.1 | |
|---|---|---|
| 0 | Daily SMA20 | 1943.80 |
| 1 | Daily SMA50 | 1972.29 |
| 2 | Daily SMA100 | 1943.58 |
| 3 | Daily SMA200 | 1857.02 |
The previous day high was 1917.26 while the previous day low was 1902.91. The daily 38.2% Fib levels comes at 1908.39, expected to provide resistance. Similarly, the daily 61.8% fib level is at 1911.78, expected to provide resistance.
Note the levels of interest below:
- Pivot support is noted at 1901.11, 1894.83, 1886.76
- Pivot resistance is noted at 1915.46, 1923.53, 1929.81
| Levels | Levels.1 |
|---|---|
| Previous Daily High | 1917.26 |
| Previous Daily Low | 1902.91 |
| Previous Weekly High | 1958.85 |
| Previous Weekly Low | 1910.18 |
| Previous Monthly High | 2079.76 |
| Previous Monthly Low | 1932.12 |
| Daily Fibonacci 38.2% | 1908.39 |
| Daily Fibonacci 61.8% | 1911.78 |
| Daily Pivot Point S1 | 1901.11 |
| Daily Pivot Point S2 | 1894.83 |
| Daily Pivot Point S3 | 1886.76 |
| Daily Pivot Point R1 | 1915.46 |
| Daily Pivot Point R2 | 1923.53 |
| Daily Pivot Point R3 | 1929.81 |
[/s2If]
Nehcap Expert Advisor
The NEHCAP MT4 EA is high quality professional trading system geared to generate returns without using GRID or martingales. Each trade has strict risk per trade parameter. The pairs under management include EURUSD, GBPUSD, AUDCAD, AUDNZD,GBPAUD, EURAUD, EURCAD, CHFJPY and many more.
The system is trading live: LIVE ACCOUNT TRACKING
You can run it free. Apply for a free trial and track our account. Buy the system or use profit share mechanism to generate returns on your MT4.
Join Our Telegram Group
")


