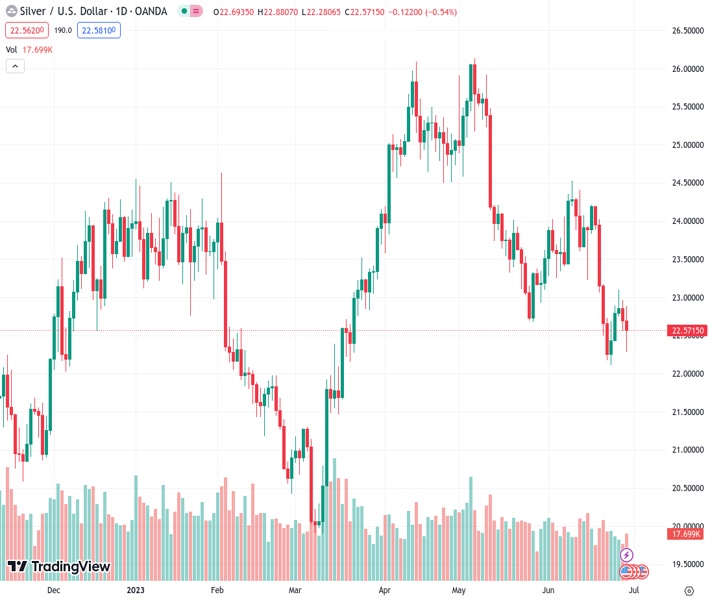
Silver prices decline for the second consecutive day due to optimistic news from the United States and speculations of the Federal Reserve implementing stricter measures. Currently, the trading price of silver stands at $22.57.
…
This is a premium post.
[s2If !current_user_can(access_s2member_level4)]Please register for FREE REGISTER to read full post below containing analysis. In case of any error or you think you are not able to read the full post below, please email us at support#nehcap.com [lwa][/s2If] [s2If current_user_can(access_s2member_level1)]
- Silver prices fall for a second day on positive US news and Fed tightening speculations, with XAG/USD trading at $22.57.
The pair currently trades last at 22.566.
The previous day high was 22.96 while the previous day low was 22.56. The daily 38.2% Fib levels comes at 22.72, expected to provide resistance. Similarly, the daily 61.8% fib level is at 22.81, expected to provide resistance.
Silver price slides for the second consecutive day due to positive news from the United States (US), which cooled recessionary fears while increasing speculations of further tightening by the US Federal Reserve (Fed). Therefore, the XAG/USD is trading at $22.57, down 0.56%
In the medium term, the XAG/USD is set to continue to trend lower after drifting below the 200-day Exponential Moving Average (EMA)
The XAG/USD would likely continue to trend lower in the medium term after breaching the 200-day Exponential Moving Average (EMA). In addition, the May 26 daily low of $22.68 was surpassed, seen as the latest support before the XAG/USD extended its fall toward the March 16 daily low of $21.47.
Further cementing the bearish case is the Relative Strength Index (RSI), sitting below its neutral line, while the three-day Rate of Change (RoC) shifted negatively, a sign that sellers are in charge.
The XAG/USD first support would be the June 23 swing low of $22.11. A breach of the latter will expose the $22.00 figure, followed by the abovementioned March 16 swing low of $21.47, before dropping towards the $21.00 figure.
If the XAG/USD reclaims the 200-day EMA, the next resistance would ev the $23.00 mark before testing the 20-day EMA at $23.19.
Technical Levels: Supports and Resistances
XAGUSD currently trading at 22.58 at the time of writing. Pair opened at 22.7 and is trading with a change of -0.53 % .
| Overview | Overview.1 | |
|---|---|---|
| 0 | Today last price | 22.58 |
| 1 | Today Daily Change | -0.12 |
| 2 | Today Daily Change % | -0.53 |
| 3 | Today daily open | 22.70 |
The pair is trading below its 20 Daily moving average @ 23.46, below its 50 Daily moving average @ 24.04 , below its 100 Daily moving average @ 23.34 and above its 200 Daily moving average @ 22.54
| Trends | Trends.1 | |
|---|---|---|
| 0 | Daily SMA20 | 23.46 |
| 1 | Daily SMA50 | 24.04 |
| 2 | Daily SMA100 | 23.34 |
| 3 | Daily SMA200 | 22.54 |
The previous day high was 22.96 while the previous day low was 22.56. The daily 38.2% Fib levels comes at 22.72, expected to provide resistance. Similarly, the daily 61.8% fib level is at 22.81, expected to provide resistance.
Note the levels of interest below:
- Pivot support is noted at 22.52, 22.34, 22.12
- Pivot resistance is noted at 22.92, 23.14, 23.32
| Levels | Levels.1 |
|---|---|
| Previous Daily High | 22.96 |
| Previous Daily Low | 22.56 |
| Previous Weekly High | 24.20 |
| Previous Weekly Low | 22.11 |
| Previous Monthly High | 26.14 |
| Previous Monthly Low | 22.68 |
| Daily Fibonacci 38.2% | 22.72 |
| Daily Fibonacci 61.8% | 22.81 |
| Daily Pivot Point S1 | 22.52 |
| Daily Pivot Point S2 | 22.34 |
| Daily Pivot Point S3 | 22.12 |
| Daily Pivot Point R1 | 22.92 |
| Daily Pivot Point R2 | 23.14 |
| Daily Pivot Point R3 | 23.32 |
[/s2If]
Nehcap Expert Advisor
The NEHCAP MT4 EA is high quality professional trading system geared to generate returns without using GRID or martingales. Each trade has strict risk per trade parameter. The pairs under management include EURUSD, GBPUSD, AUDCAD, AUDNZD,GBPAUD, EURAUD, EURCAD, CHFJPY and many more.
The system is trading live: LIVE ACCOUNT TRACKING
You can run it free. Apply for a free trial and track our account. Buy the system or use profit share mechanism to generate returns on your MT4.
Join Our Telegram Group
")


