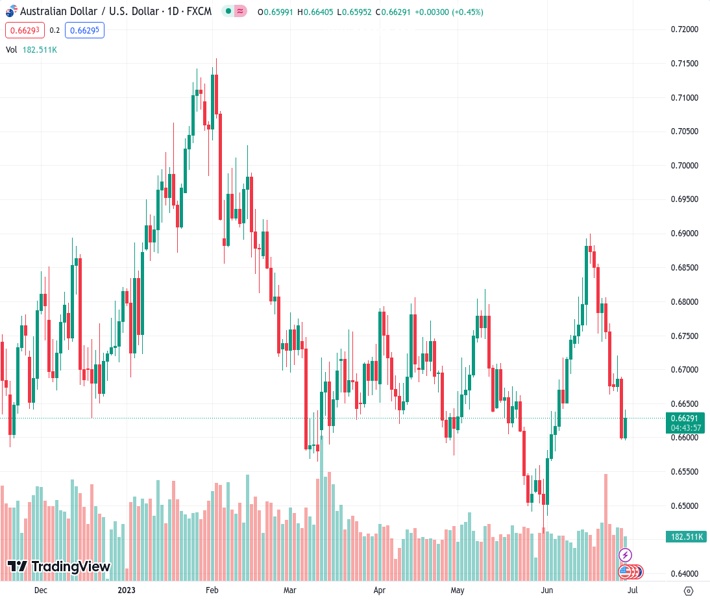
The AUDUSD currency pair reached its highest point of the day at 0.6640 after being valued at 0.66314, but later declined towards the vicinity of 0.6600.
…
This is a premium post.
[s2If !current_user_can(access_s2member_level4)]Please register for FREE REGISTER to read full post below containing analysis. In case of any error or you think you are not able to read the full post below, please email us at support#nehcap.com [lwa][/s2If] [s2If current_user_can(access_s2member_level1)]
- AUD/USD peaked at a daily high of 0.6640 and then fell towards the 0.6600 area.
The pair currently trades last at 0.66314.
The previous day high was 0.669 while the previous day low was 0.6597. The daily 38.2% Fib levels comes at 0.6633, expected to provide resistance. Similarly, the daily 61.8% fib level is at 0.6654, expected to provide resistance.
On Thursday, the AUD/USD – after jumping to a daily high of 0.6640 – retreated towards 0.6600 and then climbed back to 0.6630. The upward revision of US Q1 GDP figures and a decrease in Jobless Claims during the third week of June provided evidence of a robust economic recovery in the US. On the negative tone, Pending Home sales came in weak and limited the Greenback’s advance while the Aussie stayed resilient on the back of strong Retail Sales data reported in the Asian session which came in at 0.7% MoM vs the 0.1% expected.
The US Bureau of Economic Analysis reported that the Gross Domestic Product (GDP) from the US from Q1 was revised to the upside to an annualized rate of 2% signaling a resilient American economy. In addition, Jobless Claims for the week ending in June 23 dropped to 239K vs the consensus of 265k and from the previous 265k. It’s worth noticing that on Wednesday, Jerome Powell, chairman of the Fed, stated that ongoing hikes driven by a strong labor market would be appropriate, so hawkish bets following the Jobless and GDP data are strengthening the USD.
In that sense, the US bond yields rallied across the board. The 2-year and 5-year bond rates led the way seeing 3.52% and 4.18% increases on the day to 4.87% and 4.13% respectively and both of them jumped to fresh cycle highs.
Meanwhile, as per the CME FedWatch Tool, the odds of a 25 basis points (bps) rate hike at the next Fed meeting in July jumped from nearly 80% to 90%. All eyes are now on Friday’s Core Personal Consumption Expenditures (PCE) data, the Fed’s preferred inflation gauge.
According to the daily chart, the outlook for the AUD/USD has shifted towards a more neutral to bearish stance in the short term. The Relative Strength Index (RSI) has shown signs of improvement, though it is still in negative territory, as well as the Moving Average Convergence Divergence (MACD). However, the pair is trading below the 20,100 and 200-day Simple Moving Averages (SMA), which indicates that sellers have the upperhand.
Support levels to watch: 0.6595,0.6585,0.6550.
Resistances: 0.6640, 0.6650,0.6665.
Technical Levels: Supports and Resistances
AUDUSD currently trading at 0.6632 at the time of writing. Pair opened at 0.6601 and is trading with a change of 0.47 % .
| Overview | Overview.1 | |
|---|---|---|
| 0 | Today last price | 0.6632 |
| 1 | Today Daily Change | 0.0031 |
| 2 | Today Daily Change % | 0.4700 |
| 3 | Today daily open | 0.6601 |
The pair remains strongly bearish on the daily time frame. It trades below the 20 SMA @ 0.6724, 50 SMA 0.6677, 100 SMA @ 0.6706 and 200 SMA @ 0.6692.
| Trends | Trends.1 | |
|---|---|---|
| 0 | Daily SMA20 | 0.6724 |
| 1 | Daily SMA50 | 0.6677 |
| 2 | Daily SMA100 | 0.6706 |
| 3 | Daily SMA200 | 0.6692 |
The previous day high was 0.669 while the previous day low was 0.6597. The daily 38.2% Fib levels comes at 0.6633, expected to provide resistance. Similarly, the daily 61.8% fib level is at 0.6654, expected to provide resistance.
Note the levels of interest below:
- Pivot support is noted at 0.6569, 0.6536, 0.6476
- Pivot resistance is noted at 0.6661, 0.6722, 0.6754
| Levels | Levels.1 |
|---|---|
| Previous Daily High | 0.6690 |
| Previous Daily Low | 0.6597 |
| Previous Weekly High | 0.6886 |
| Previous Weekly Low | 0.6663 |
| Previous Monthly High | 0.6818 |
| Previous Monthly Low | 0.6458 |
| Daily Fibonacci 38.2% | 0.6633 |
| Daily Fibonacci 61.8% | 0.6654 |
| Daily Pivot Point S1 | 0.6569 |
| Daily Pivot Point S2 | 0.6536 |
| Daily Pivot Point S3 | 0.6476 |
| Daily Pivot Point R1 | 0.6661 |
| Daily Pivot Point R2 | 0.6722 |
| Daily Pivot Point R3 | 0.6754 |
[/s2If]
Nehcap Expert Advisor
The NEHCAP MT4 EA is high quality professional trading system geared to generate returns without using GRID or martingales. Each trade has strict risk per trade parameter. The pairs under management include EURUSD, GBPUSD, AUDCAD, AUDNZD,GBPAUD, EURAUD, EURCAD, CHFJPY and many more.
The system is trading live: LIVE ACCOUNT TRACKING
You can run it free. Apply for a free trial and track our account. Buy the system or use profit share mechanism to generate returns on your MT4.
Join Our Telegram Group
")


