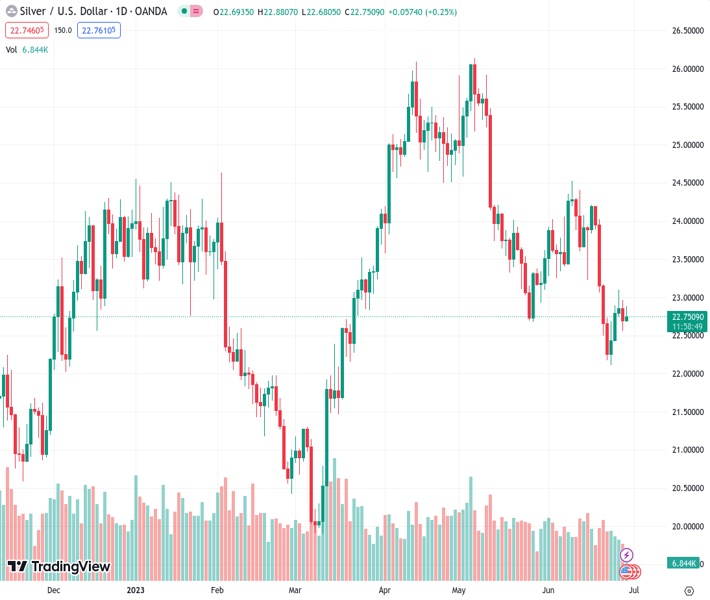
Silver, represented by the symbol XAGUSD, experiences a rise in value at 22.754 on Thursday, although there is a lack of continued buying momentum.
…
This is a premium post.
[s2If !current_user_can(access_s2member_level4)]Please register for FREE REGISTER to read full post below containing analysis. In case of any error or you think you are not able to read the full post below, please email us at support#nehcap.com [lwa][/s2If] [s2If current_user_can(access_s2member_level1)]
- Silver regains positive traction on Thursday, albeit lacks follow-through buying.
The pair currently trades last at 22.754.
The previous day high was 22.96 while the previous day low was 22.56. The daily 38.2% Fib levels comes at 22.72, expected to provide support. Similarly, the daily 61.8% fib level is at 22.81, expected to provide resistance.
Silver attracts some buyers near the 100-hour Simple Moving Average (SMA) on Thursday and reverses a major part of its losses recorded the previous day; The white metal, however, struggles to make it through the 38.2% Fibonacci retracement level of the last week’s downfall and trades around the $22.75-$22.80 region, up over 0.40% for the day during the first half of the European session.
From a technical perspective, the XAG/USD this week struggles to find acceptance above the $23.00 mark and faced rejection just ahead of the 50% Fibo. level. The subsequent downfall, however, stalls near the $22.55 confluence, comprising the 100-hour SMA and the 23.6% Fibo. level. The said ares should now act as a pivotal point, which if broken decisively will be seen as a fresh trigger for bearish traders. The XAG/USD might slide back to retest the multi-month low, around the $22.10 region touched last week.
Some follow-through selling below the $22.00 mark should pave the way for deeper losses and accelerate the fall further towards the $21.70-$21.65 zone. The downward trajectory could get extended further towards the next relevant support near the $21.25 region before the XAG/USD eventually drops to the $21.00 round figure.
On the flip side, any further intraday move up might continue to confront stiff resistance near the $23.00 mark, or 200-hour SMA. This is closely followed by the 50% Fibo., around the $23.15 region, and the $23.40 area, or the 61.8% Fibo. A convincing break through the latter will confirm that the XAG/USD has formed a near-term bottom just ahead of the $22.00 mark and trigger a fresh bout of a short-covering rally. This should pave the for some meaningful appreciating move and lift the white metal to the $23.65-$23.70 hurdle.
Technical Levels: Supports and Resistances
XAGUSD currently trading at 22.79 at the time of writing. Pair opened at 22.7 and is trading with a change of 0.4 % .
| Overview | Overview.1 | |
|---|---|---|
| 0 | Today last price | 22.79 |
| 1 | Today Daily Change | 0.09 |
| 2 | Today Daily Change % | 0.40 |
| 3 | Today daily open | 22.70 |
The pair is trading below its 20 Daily moving average @ 23.46, below its 50 Daily moving average @ 24.04 , below its 100 Daily moving average @ 23.34 and above its 200 Daily moving average @ 22.54
| Trends | Trends.1 | |
|---|---|---|
| 0 | Daily SMA20 | 23.46 |
| 1 | Daily SMA50 | 24.04 |
| 2 | Daily SMA100 | 23.34 |
| 3 | Daily SMA200 | 22.54 |
The previous day high was 22.96 while the previous day low was 22.56. The daily 38.2% Fib levels comes at 22.72, expected to provide support. Similarly, the daily 61.8% fib level is at 22.81, expected to provide resistance.
Note the levels of interest below:
- Pivot support is noted at 22.52, 22.34, 22.12
- Pivot resistance is noted at 22.92, 23.14, 23.32
| Levels | Levels.1 |
|---|---|
| Previous Daily High | 22.96 |
| Previous Daily Low | 22.56 |
| Previous Weekly High | 24.20 |
| Previous Weekly Low | 22.11 |
| Previous Monthly High | 26.14 |
| Previous Monthly Low | 22.68 |
| Daily Fibonacci 38.2% | 22.72 |
| Daily Fibonacci 61.8% | 22.81 |
| Daily Pivot Point S1 | 22.52 |
| Daily Pivot Point S2 | 22.34 |
| Daily Pivot Point S3 | 22.12 |
| Daily Pivot Point R1 | 22.92 |
| Daily Pivot Point R2 | 23.14 |
| Daily Pivot Point R3 | 23.32 |
[/s2If]
Nehcap Expert Advisor
The NEHCAP MT4 EA is high quality professional trading system geared to generate returns without using GRID or martingales. Each trade has strict risk per trade parameter. The pairs under management include EURUSD, GBPUSD, AUDCAD, AUDNZD,GBPAUD, EURAUD, EURCAD, CHFJPY and many more.
The system is trading live: LIVE ACCOUNT TRACKING
You can run it free. Apply for a free trial and track our account. Buy the system or use profit share mechanism to generate returns on your MT4.
Join Our Telegram Group
")


