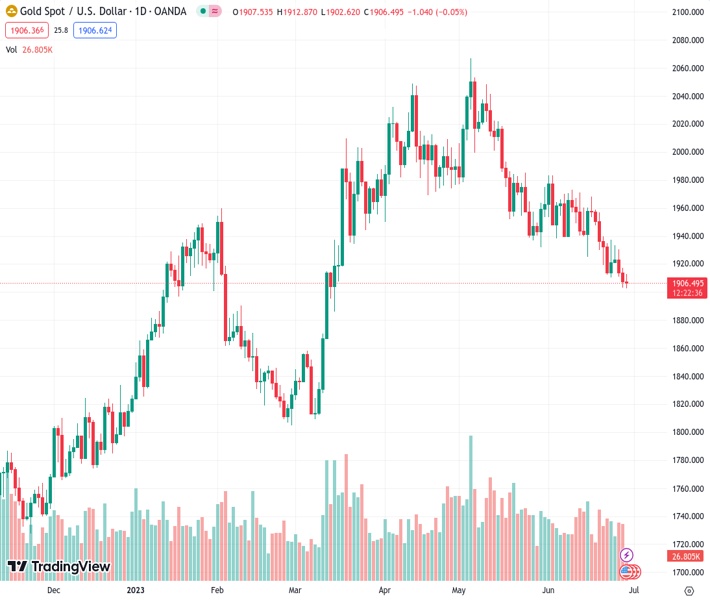
The price of gold, represented by XAUUSD at 1,906.47, continues to decline for the fourth consecutive day and reaches its lowest point in over three months.
…
This is a premium post.
[s2If !current_user_can(access_s2member_level4)]Please register for FREE REGISTER to read full post below containing analysis. In case of any error or you think you are not able to read the full post below, please email us at support#nehcap.com [lwa][/s2If] [s2If current_user_can(access_s2member_level1)]
- Gold price drifts lower for the fourth straight day and drops to over a three-month low.
The pair currently trades last at 1906.47.
The previous day high was 1917.26 while the previous day low was 1902.91. The daily 38.2% Fib levels comes at 1908.39, expected to provide resistance. Similarly, the daily 61.8% fib level is at 1911.78, expected to provide resistance.
Gold price attracts fresh sellers following an intraday uptick to the $1,912-$1,913 region and drifts into negative territory for the fourth successive day on Thursday. The XAU/USD remains on the defensive heading into the European session and is currently placed near its lowest level since mid-March, just above the $1,900 round-figure mark.
The US Dollar (USD) builds to Wednesday’s strong move up and climbs to a fresh two-week peak, which, in turn, is seen as a key factor undermining the Gold price. Federal Reserve (Fed) Chair Jerome Powell’s, Speaking at a European Central Bank (ECB) conference on Wednesday, reiterated that two rate increases are likely this year and said that he does not see inflation coming down to the Fed’s 2% target until 2025. This reaffirms market bets for a 25 bps lift-off at the next FOMC policy meeting on July 25-26, pushing the US Treasury bond yields higher and benefitting the Greenback.
Apart from this, a more hawkish outlook by other major central bank contributes to driving flows away from the non-yielding Gold price. In fact, the European Central Bank (ECB) President Christine Lagarde said that inflation in the Eurozone had entered a new phase that could linger for some time. Lagarde added that it is unlikely that in the near future the central bank will be able to state with full confidence that the peak rates have been reached. Furthermore, the Bank of England (BoE) Governor Andrew Bailey hinted that rates could remain at peak levels for longer than traders currently expect.
The aforementioned fundamental backdrop seems tilted firmly in favour of bearish traders and supports prospects for a further near-term depreciating move for Gold price. That said, the worsening global economic outlook, along with concerns about deteriorating US-China relations, could lend some support to the safe-haven XAU/USD, for the time being. Traders might also refrain from placing aggressive bets and move to the sidelines ahead of Friday’s key releases – the official Chinese PMI prints for June and the US Core PCE Price Index – the Fed’s preferred inflation gauge.
Technical Levels: Supports and Resistances
XAUUSD currently trading at 1904.69 at the time of writing. Pair opened at 1907.38 and is trading with a change of -0.14 % .
| Overview | Overview.1 | |
|---|---|---|
| 0 | Today last price | 1904.69 |
| 1 | Today Daily Change | -2.69 |
| 2 | Today Daily Change % | -0.14 |
| 3 | Today daily open | 1907.38 |
The pair is trading below its 20 Daily moving average @ 1943.8, below its 50 Daily moving average @ 1972.29 , below its 100 Daily moving average @ 1943.58 and above its 200 Daily moving average @ 1857.02
| Trends | Trends.1 | |
|---|---|---|
| 0 | Daily SMA20 | 1943.80 |
| 1 | Daily SMA50 | 1972.29 |
| 2 | Daily SMA100 | 1943.58 |
| 3 | Daily SMA200 | 1857.02 |
The previous day high was 1917.26 while the previous day low was 1902.91. The daily 38.2% Fib levels comes at 1908.39, expected to provide resistance. Similarly, the daily 61.8% fib level is at 1911.78, expected to provide resistance.
Note the levels of interest below:
- Pivot support is noted at 1901.11, 1894.83, 1886.76
- Pivot resistance is noted at 1915.46, 1923.53, 1929.81
| Levels | Levels.1 |
|---|---|
| Previous Daily High | 1917.26 |
| Previous Daily Low | 1902.91 |
| Previous Weekly High | 1958.85 |
| Previous Weekly Low | 1910.18 |
| Previous Monthly High | 2079.76 |
| Previous Monthly Low | 1932.12 |
| Daily Fibonacci 38.2% | 1908.39 |
| Daily Fibonacci 61.8% | 1911.78 |
| Daily Pivot Point S1 | 1901.11 |
| Daily Pivot Point S2 | 1894.83 |
| Daily Pivot Point S3 | 1886.76 |
| Daily Pivot Point R1 | 1915.46 |
| Daily Pivot Point R2 | 1923.53 |
| Daily Pivot Point R3 | 1929.81 |
[/s2If]
Nehcap Expert Advisor
The NEHCAP MT4 EA is high quality professional trading system geared to generate returns without using GRID or martingales. Each trade has strict risk per trade parameter. The pairs under management include EURUSD, GBPUSD, AUDCAD, AUDNZD,GBPAUD, EURAUD, EURCAD, CHFJPY and many more.
The system is trading live: LIVE ACCOUNT TRACKING
You can run it free. Apply for a free trial and track our account. Buy the system or use profit share mechanism to generate returns on your MT4.
Join Our Telegram Group
")


