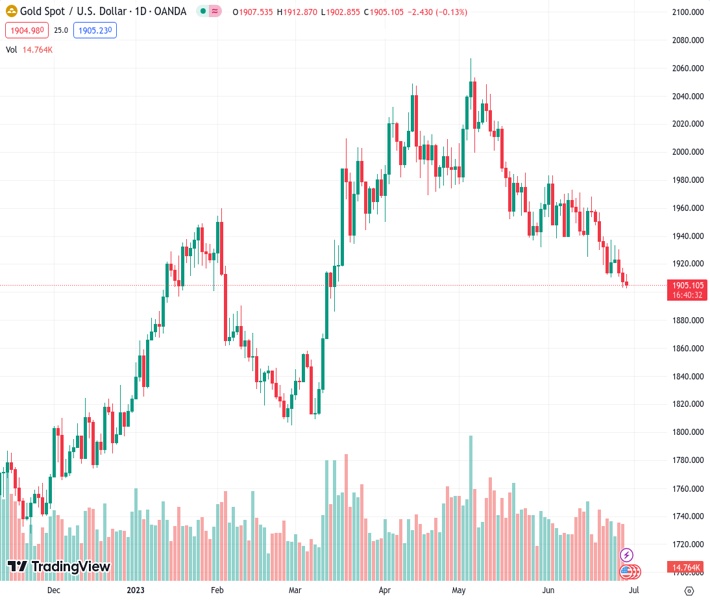
The price of gold, at 1,904.66 in the XAUUSD market, has been unable to maintain its small upward movement during the day and remains close to its lowest level in several months.
…
This is a premium post.
[s2If !current_user_can(access_s2member_level4)]Please register for FREE REGISTER to read full post below containing analysis. In case of any error or you think you are not able to read the full post below, please email us at support#nehcap.com [lwa][/s2If] [s2If current_user_can(access_s2member_level1)]
- Gold price fails to preserve its modest intraday gains and hangs near a multi-month low.
The pair currently trades last at 1904.66.
The previous day high was 1917.26 while the previous day low was 1902.91. The daily 38.2% Fib levels comes at 1908.39, expected to provide resistance. Similarly, the daily 61.8% fib level is at 1911.78, expected to provide resistance.
Gold price struggles to capitalize on its modest gains registered during the Asian session and turns lower for the fourth straight day on Thursday. The XAU/USD currently trades around the $1,905, just above its lowest level since mid-March touched on Wednesday and seems vulnerable to slide further.
A more hawkish outlook adopted by major central banks and the prospects for additional interest rate hikes continue to act as a headwind for the non-yielding Gold price. In fact, the European Central Bank (ECB) President Christine Lagarde said on Wednesday that inflation in the Eurozone had entered a new phase that could linger for some time. Lagarde further noted that it is unlikely that in the near future the central bank will be able to state with full confidence that the peak rates have been reached. Furthermore, the Bank of England (BoE) Governor Andrew Bailey, speaking at the ECB conference, hinted that rates could remain at peak levels for longer than traders currently expect.
Adding to this, Federal Reserve (Fed) Chair Jerome Powell reiterated that two rate increases are likely this year and did not rule out the possibility of a lift-off at the next policy meeting on July 25-26. Powell also said that he does not see inflation coming down to the Fed’s 2% target until 2025. This, in turn, assists the US Dollar (USD) to stand tall near a two-week high, which is seen as another factor exerting pressure on the Gold price. Tha said, worries about economic headwinds stemming from rapidly rising borrowing costs might hold back traders from placing aggressive bearish bets around the safe-haven precious metal and help limit any further losses, at least for the time being.
Market participants now look forward to the US economic docket, featuring the final Q1 GDP print, the usual Weekly Initial Jobless Claims and Pending Home Sales data, due later during the early North American session. The data might drive the USD demand and provide some impetus to the Gold price. The focus, however, remains clued to the release of the Personal Consumption Expenditure (PCE) Price Index from the United States (US) on Friday. This will play a key role in influencing the Fed’s rate-hike path and provide a fresh directional impetus to the XAU/USD.
From a technical perspective, some follow-through selling and acceptance below the $1,900 mark will be seen as a fresh trigger for bearish traders. Given that oscillators on the daily chart are holding deep in the negative territory and are still far from being in the oversold zone, Gold price might then accelerate the fall towards the $1,876-$1,875 area. The downward trajectory could get extended further towards challenging the very important 200-day Simple Moving Average (SMA), currently pegged around the $1,840 region.
On the flip side, any positive move beyond the $1,912-$1,913 zone, or the Asian session peak, might now confront resistance near the $1,924-$1,925 region ahead of the $1,936 area. This is closely followed by the 100-day SMA, currently around the $1,942 zone. A sustaiend strenght above might trigger a short-covering rally towards the $1,962-$1,964 hurdle en route to the $1,970-$1,972 supply zone. Some follow-through buying should allow Gold price to reclaim the $2,000 psychological mark and climb further towards the $2,010-$2,012 hurdle.
Technical Levels: Supports and Resistances
XAUUSD currently trading at 1905.96 at the time of writing. Pair opened at 1907.38 and is trading with a change of -0.07 % .
| Overview | Overview.1 | |
|---|---|---|
| 0 | Today last price | 1905.96 |
| 1 | Today Daily Change | -1.42 |
| 2 | Today Daily Change % | -0.07 |
| 3 | Today daily open | 1907.38 |
The pair is trading below its 20 Daily moving average @ 1943.8, below its 50 Daily moving average @ 1972.29 , below its 100 Daily moving average @ 1943.58 and above its 200 Daily moving average @ 1857.02
| Trends | Trends.1 | |
|---|---|---|
| 0 | Daily SMA20 | 1943.80 |
| 1 | Daily SMA50 | 1972.29 |
| 2 | Daily SMA100 | 1943.58 |
| 3 | Daily SMA200 | 1857.02 |
The previous day high was 1917.26 while the previous day low was 1902.91. The daily 38.2% Fib levels comes at 1908.39, expected to provide resistance. Similarly, the daily 61.8% fib level is at 1911.78, expected to provide resistance.
Note the levels of interest below:
- Pivot support is noted at 1901.11, 1894.83, 1886.76
- Pivot resistance is noted at 1915.46, 1923.53, 1929.81
| Levels | Levels.1 |
|---|---|
| Previous Daily High | 1917.26 |
| Previous Daily Low | 1902.91 |
| Previous Weekly High | 1958.85 |
| Previous Weekly Low | 1910.18 |
| Previous Monthly High | 2079.76 |
| Previous Monthly Low | 1932.12 |
| Daily Fibonacci 38.2% | 1908.39 |
| Daily Fibonacci 61.8% | 1911.78 |
| Daily Pivot Point S1 | 1901.11 |
| Daily Pivot Point S2 | 1894.83 |
| Daily Pivot Point S3 | 1886.76 |
| Daily Pivot Point R1 | 1915.46 |
| Daily Pivot Point R2 | 1923.53 |
| Daily Pivot Point R3 | 1929.81 |
[/s2If]
Nehcap Expert Advisor
The NEHCAP MT4 EA is high quality professional trading system geared to generate returns without using GRID or martingales. Each trade has strict risk per trade parameter. The pairs under management include EURUSD, GBPUSD, AUDCAD, AUDNZD,GBPAUD, EURAUD, EURCAD, CHFJPY and many more.
The system is trading live: LIVE ACCOUNT TRACKING
You can run it free. Apply for a free trial and track our account. Buy the system or use profit share mechanism to generate returns on your MT4.
Join Our Telegram Group
")


