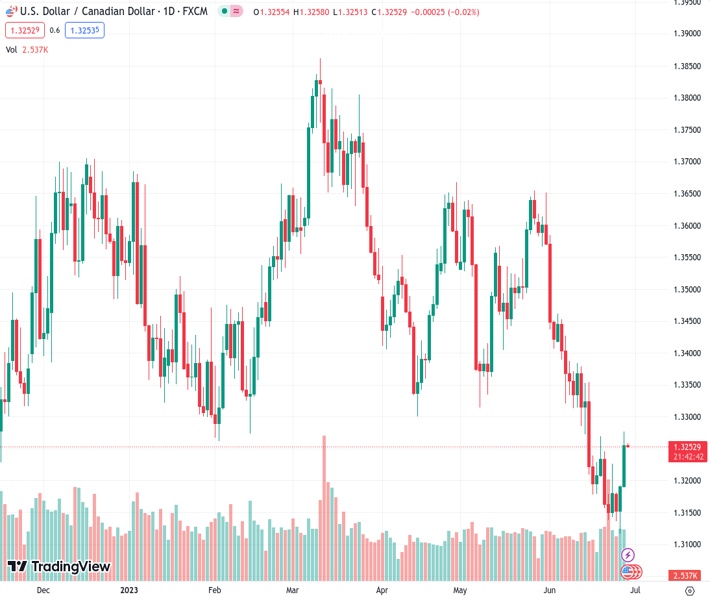
The USDCAD pair, currently trading at 1.32538, remains steady around its highest levels in two weeks. This comes after experiencing its largest increase in five weeks. The prediction from @nehcap is that there is potential for the pair to continue rising.
…
This is a premium post.
[s2If !current_user_can(access_s2member_level4)]Please register for FREE REGISTER to read full post below containing analysis. In case of any error or you think you are not able to read the full post below, please email us at support#nehcap.com [lwa][/s2If] [s2If current_user_can(access_s2member_level1)]
- USD/CAD grinds near the highest levels in fortnight after rising the most in five weeks.
The pair currently trades last at 1.32538.
The previous day high was 1.3192 while the previous day low was 1.3117. The daily 38.2% Fib levels comes at 1.3163, expected to provide support. Similarly, the daily 61.8% fib level is at 1.3146, expected to provide support.
USD/CAD remains on the front foot at a two-week high, despite the early Asian session inaction around 1.3250 on Thursday. That said, the Loonie pair jumped the most in five weeks the previous day after crossing a downward-sloping resistance line from June. However, the overbought RSI (14) line and the 100-SMA appear to challenge the buyers of late.
That said, a sustained upside break of the multi-day-old resistance line, now support around 1.3210, joins the bullish MACD signals and the pair’s successful trading beyond the rising support line from Tuesday, close to 1.3240 at the latest, keeps the USD/CAD buyers hopeful.
With this, the Loonie pair is expected to overcome the immediate 100-SMA hurdle surrounding 1.3260 while targeting the early May swing low of around 1.3315.
It should be noted, however, that a convergence of the 200-SMA and 50% Fibonacci retracement of the USD/CAD pair’s April-June downturn, near 1.3390, appears a tough nut to crack for the bulls afterward.
On the contrary, a downside break of the immediate support line and the resistance-turned-support trend line, respectively near 1.3240 and 1.3210, becomes necessary for the USD/CAD bear’s return.
Following that, the yearly low marked earlier in the week around 1.3120 and the 1.3000 psychological magnet will gain the market’s attention.
Trend: Further upside expected
Technical Levels: Supports and Resistances
USDCAD currently trading at 1.3255 at the time of writing. Pair opened at 1.3192 and is trading with a change of 0.48% % .
| Overview | Overview.1 | |
|---|---|---|
| 0 | Today last price | 1.3255 |
| 1 | Today Daily Change | 0.0063 |
| 2 | Today Daily Change % | 0.48% |
| 3 | Today daily open | 1.3192 |
The pair remains strongly bearish on the daily time frame. It trades below the 20 SMA @ 1.3304, 50 SMA 1.3437, 100 SMA @ 1.35 and 200 SMA @ 1.3518.
| Trends | Trends.1 | |
|---|---|---|
| 0 | Daily SMA20 | 1.3304 |
| 1 | Daily SMA50 | 1.3437 |
| 2 | Daily SMA100 | 1.3500 |
| 3 | Daily SMA200 | 1.3518 |
The previous day high was 1.3192 while the previous day low was 1.3117. The daily 38.2% Fib levels comes at 1.3163, expected to provide support. Similarly, the daily 61.8% fib level is at 1.3146, expected to provide support.
Note the levels of interest below:
- Pivot support is noted at 1.3142, 1.3091, 1.3066
- Pivot resistance is noted at 1.3217, 1.3243, 1.3293
| Levels | Levels.1 |
|---|---|
| Previous Daily High | 1.3192 |
| Previous Daily Low | 1.3117 |
| Previous Weekly High | 1.3270 |
| Previous Weekly Low | 1.3139 |
| Previous Monthly High | 1.3655 |
| Previous Monthly Low | 1.3315 |
| Daily Fibonacci 38.2% | 1.3163 |
| Daily Fibonacci 61.8% | 1.3146 |
| Daily Pivot Point S1 | 1.3142 |
| Daily Pivot Point S2 | 1.3091 |
| Daily Pivot Point S3 | 1.3066 |
| Daily Pivot Point R1 | 1.3217 |
| Daily Pivot Point R2 | 1.3243 |
| Daily Pivot Point R3 | 1.3293 |
[/s2If]
Nehcap Expert Advisor
The NEHCAP MT4 EA is high quality professional trading system geared to generate returns without using GRID or martingales. Each trade has strict risk per trade parameter. The pairs under management include EURUSD, GBPUSD, AUDCAD, AUDNZD,GBPAUD, EURAUD, EURCAD, CHFJPY and many more.
The system is trading live: LIVE ACCOUNT TRACKING
You can run it free. Apply for a free trial and track our account. Buy the system or use profit share mechanism to generate returns on your MT4.
Join Our Telegram Group
")


