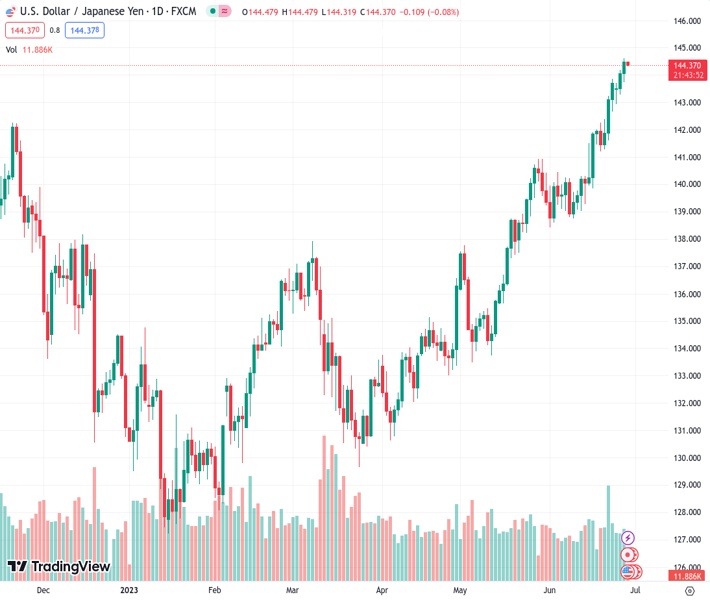
The USDJPY pair has been increasing in value for the past six days, reaching a new yearly high at a price of 144.386. However, its upward movement has slowed down as it prepares for the opening of the Tokyo market.
…
This is a premium post.
[s2If !current_user_can(access_s2member_level4)]Please register for FREE REGISTER to read full post below containing analysis. In case of any error or you think you are not able to read the full post below, please email us at support#nehcap.com [lwa][/s2If] [s2If current_user_can(access_s2member_level1)]
- USD/JPY extends gains for six consecutive days, hitting a new YTD high but stabilizing ahead of the Tokyo Open.
The pair currently trades last at 144.386.
The previous day high was 144.18 while the previous day low was 143.28. The daily 38.2% Fib levels comes at 143.83, expected to provide support. Similarly, the daily 61.8% fib level is at 143.62, expected to provide support.
The USD/JPY extends its gains to six straight days, but as Thursday’s Asian session begins, it retraces some 0.08% ahead of the Tokyo open. On its way north, the USD/JPY reached a new year-to-date (YTD) high of 144.61 but stabilized and finished around 144.40. At the time of writing, the USD/JPY exchanges hands at around the 144.30 area.
The USD/JPY remains upward biased but subject to verbal intervention by Japanese authorities. Even though the Relative Strength Index (RSI) suggests that prices are overbought, it remains shy of reaching extreme readings close to 80. In this case, the USD/JPY strong uptrend justifies RSI above 70, and once it comes the 80 level, the chances for a possible reversal increase.
Oscillators like the Relative Strength Index (RSI) is overbought but shy of getting to 80, while the three-day Rate of Change (RoC) suggests buying pressure is fading.
If USD/JPY climbs past 145.00, the next resistance will be the October 27 daily low at 145.10. Breach of the latter will expose the 146.00 figure, followed by the November 10 daily high at 146.59.
Conversely, if USD/JPY prints a reversal, the next support would be the 144.00 figure. Break below will expose the June 28 daily low of 143.73, followed by the November 22 daily high of 142.24.
Technical Levels: Supports and Resistances
USDJPY currently trading at 144.41 at the time of writing. Pair opened at 144.08 and is trading with a change of 0.23 % .
| Overview | Overview.1 | |
|---|---|---|
| 0 | Today last price | 144.41 |
| 1 | Today Daily Change | 0.33 |
| 2 | Today Daily Change % | 0.23 |
| 3 | Today daily open | 144.08 |
The pair remains strongly bullish on the daily timeframe. It trades above its 20 SMA @ 140.88, 50 SMA 138.19, 100 SMA @ 135.88 and 200 SMA @ 137.22.
| Trends | Trends.1 | |
|---|---|---|
| 0 | Daily SMA20 | 140.88 |
| 1 | Daily SMA50 | 138.19 |
| 2 | Daily SMA100 | 135.88 |
| 3 | Daily SMA200 | 137.22 |
The previous day high was 144.18 while the previous day low was 143.28. The daily 38.2% Fib levels comes at 143.83, expected to provide support. Similarly, the daily 61.8% fib level is at 143.62, expected to provide support.
Note the levels of interest below:
- Pivot support is noted at 143.51, 142.95, 142.62
- Pivot resistance is noted at 144.41, 144.74, 145.3
| Levels | Levels.1 |
|---|---|
| Previous Daily High | 144.18 |
| Previous Daily Low | 143.28 |
| Previous Weekly High | 143.87 |
| Previous Weekly Low | 141.21 |
| Previous Monthly High | 140.93 |
| Previous Monthly Low | 133.50 |
| Daily Fibonacci 38.2% | 143.83 |
| Daily Fibonacci 61.8% | 143.62 |
| Daily Pivot Point S1 | 143.51 |
| Daily Pivot Point S2 | 142.95 |
| Daily Pivot Point S3 | 142.62 |
| Daily Pivot Point R1 | 144.41 |
| Daily Pivot Point R2 | 144.74 |
| Daily Pivot Point R3 | 145.30 |
[/s2If]
Nehcap Expert Advisor
The NEHCAP MT4 EA is high quality professional trading system geared to generate returns without using GRID or martingales. Each trade has strict risk per trade parameter. The pairs under management include EURUSD, GBPUSD, AUDCAD, AUDNZD,GBPAUD, EURAUD, EURCAD, CHFJPY and many more.
The system is trading live: LIVE ACCOUNT TRACKING
You can run it free. Apply for a free trial and track our account. Buy the system or use profit share mechanism to generate returns on your MT4.
Join Our Telegram Group
")


