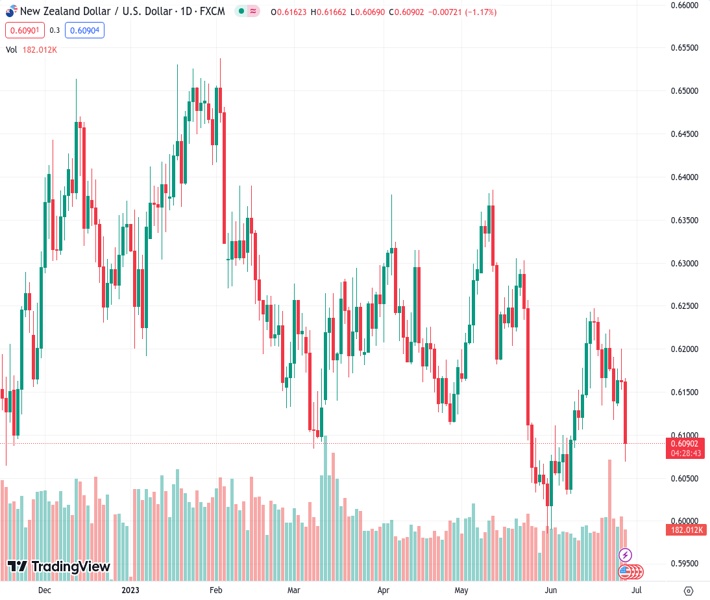
During the American session, the New Zealand dollar against the US dollar dropped to its lowest point since June 8, reaching 0.6070.
…
This is a premium post.
[s2If !current_user_can(access_s2member_level4)]Please register for FREE REGISTER to read full post below containing analysis. In case of any error or you think you are not able to read the full post below, please email us at support#nehcap.com [lwa][/s2If] [s2If current_user_can(access_s2member_level1)]
- The NZD/USD fell to its lowest low since June 8, at 0.6070 during the American session.
The pair currently trades last at 0.60900.
The previous day high was 0.6202 while the previous day low was 0.6143. The daily 38.2% Fib levels comes at 0.6165, expected to provide resistance. Similarly, the daily 61.8% fib level is at 0.6179, expected to provide resistance.
The NZD/USD currency experienced significant selling pressure, reaching its lowest level since June 8 at 0.6070 during the American session. This downward movement was triggered by hints from Jerome Powell, the Chairman of the Federal Reserve (Fed), indicating the likelihood of consecutive interest rate hikes driven by the labor market. Consequently, market participants have started assigning higher probabilities to a 25 basis points hike by the Fed in July, strengthening the US Dollar against the New Zealand Dollar.
On Wednesday, during the European Central Bank (ECB) forum in Sintra, Jerome Powell continued giving investors hawkish clues. He stated that he wouldn’t take a “move at consecutive meetings off the table” as the labor market may contribute to an uptick in inflation. Regarding economic activity, he mentioned that it is possible to get a downturn but that its not “the most likely case”.
As per the CME FedWatch Tool, investors are betting on higher odds of nearly 84% of the Federal Reserve (Fed) hiking by 25 basis points (bps) at the next July 31 meeting. As a reaction, the Greenback, measured by the DXY index, trades near 103.00 with a 0.45% gain on the day.
On the other hand, Activity Outlook and Business Confidence data from the Australia and New Zealand Banking Group will be the highlight in early Thursday’s Asian session, which could affect the Kiwi’s price dynamics.
According to the daily chart, the technical outlook for the short term for the NZD/USD has turned negative as sellers gained significant momentum. The Relative Strength (RSI) and Moving Average Convergence Divergence (MACD) fell to negative territory while the pair now trades below the 200 and 20-day Simple Moving Averages (SMA).
Support levels to watch: 0.6050,0.6040 and 0.6030 (strong support seen at the beginning of June).
Resistances: 0.6090, 20-day SMA at 0.6138 (former support), 200-day SMA at 0.6158.
Technical Levels: Supports and Resistances
NZDUSD currently trading at 0.6088 at the time of writing. Pair opened at 0.6163 and is trading with a change of -1.22 % .
| Overview | Overview.1 | |
|---|---|---|
| 0 | Today last price | 0.6088 |
| 1 | Today Daily Change | -0.0075 |
| 2 | Today Daily Change % | -1.2200 |
| 3 | Today daily open | 0.6163 |
The pair remains strongly bearish on the daily time frame. It trades below the 20 SMA @ 0.6135, 50 SMA 0.6172, 100 SMA @ 0.6202 and 200 SMA @ 0.6158.
| Trends | Trends.1 | |
|---|---|---|
| 0 | Daily SMA20 | 0.6135 |
| 1 | Daily SMA50 | 0.6172 |
| 2 | Daily SMA100 | 0.6202 |
| 3 | Daily SMA200 | 0.6158 |
The previous day high was 0.6202 while the previous day low was 0.6143. The daily 38.2% Fib levels comes at 0.6165, expected to provide resistance. Similarly, the daily 61.8% fib level is at 0.6179, expected to provide resistance.
Note the levels of interest below:
- Pivot support is noted at 0.6137, 0.6111, 0.6078
- Pivot resistance is noted at 0.6195, 0.6228, 0.6254
| Levels | Levels.1 |
|---|---|
| Previous Daily High | 0.6202 |
| Previous Daily Low | 0.6143 |
| Previous Weekly High | 0.6237 |
| Previous Weekly Low | 0.6116 |
| Previous Monthly High | 0.6385 |
| Previous Monthly Low | 0.5985 |
| Daily Fibonacci 38.2% | 0.6165 |
| Daily Fibonacci 61.8% | 0.6179 |
| Daily Pivot Point S1 | 0.6137 |
| Daily Pivot Point S2 | 0.6111 |
| Daily Pivot Point S3 | 0.6078 |
| Daily Pivot Point R1 | 0.6195 |
| Daily Pivot Point R2 | 0.6228 |
| Daily Pivot Point R3 | 0.6254 |
[/s2If]
Nehcap Expert Advisor
The NEHCAP MT4 EA is high quality professional trading system geared to generate returns without using GRID or martingales. Each trade has strict risk per trade parameter. The pairs under management include EURUSD, GBPUSD, AUDCAD, AUDNZD,GBPAUD, EURAUD, EURCAD, CHFJPY and many more.
The system is trading live: LIVE ACCOUNT TRACKING
You can run it free. Apply for a free trial and track our account. Buy the system or use profit share mechanism to generate returns on your MT4.
Join Our Telegram Group
")


