The USDCAD pair, trading at 1.32521, experiences a rapid increase to 1.3248, with a gain of over 0.40%, following Jerome Powell’s comments made at the Sintra event of the European Central Bank (ECB).
…
This is a premium post.
[s2If !current_user_can(access_s2member_level4)]Please register for FREE REGISTER to read full post below containing analysis. In case of any error or you think you are not able to read the full post below, please email us at support#nehcap.com [lwa][/s2If] [s2If current_user_can(access_s2member_level1)]
- USD/CAD climbs sharply to 1.3248, gaining more than 0.40% after Jerome Powell’s remarks at the European Central Bank (ECB) Sintra event.
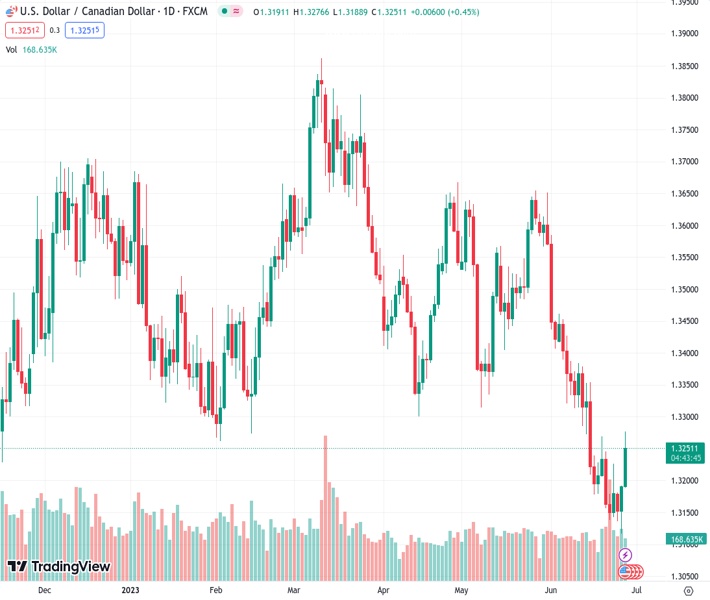
The pair currently trades last at 1.32521.
The previous day high was 1.3192 while the previous day low was 1.3117. The daily 38.2% Fib levels comes at 1.3163, expected to provide support. Similarly, the daily 61.8% fib level is at 1.3146, expected to provide support.
USD/CAD climbed sharply on Wednesday, helped by the US Federal Reserve (Fed) Chair Jerome Powell’s remarks at the European Central Bank (ECB) Sintra event, reiterating the Fed would likely hike two times as shown by the dot-plots. The USD/CAD is trading at 1.3248, gains more than 0.40% after hitting a daily low of 1.3188.
US equities are trading mixed, with the Dow Jones and S&P printing losses, while the heavy-tech Nasdaq holds to its gains. The session’s highlight has been the Chair Powell noting that policy “has not been restrictive for long,” emphasizing that most of the dot plot still sees two more increases. He added, “US economy quite resilient and latest data consistent with that” and added the Fed needs to see more softening in the labor market.
The USD/CAD reacted to Powell’s remarks, and hit a new two-week high at 1.3276, as market participants, increased the odds for a Fed 25 bps rate hike in June to 84.3%, compared to yesterday’s 76.9%, as reported by data of the CME FedWatch Tool.
Consequently, the greenback is strengthening, as shown by the US Dollar Index (DXY), which gains 0.42%, up to 102.943. Nevertheless, US Treasury bond yields are dropping, with the US 10-year benchmark note rate at 3.748%, two basis points lower than its opening price.
Regarding data, the US Trade deficit narrowed by 6.1% to $-91.1 billion, compared to April’s $-97.1 billion, as revealed by the US Department of Commerce. Sources cited by Reuters commented, “Even with the narrowing in May, the goods trade deficit is up by over 10% since March, and trade will likely be a drag on economic growth in the second quarter.”
Aside from this, the latest inflation report from Canada was softer than expected after the Bank of Canada (BoC) delivered a 25 bps rate hike on a sudden shift of monetary policy stance. The Consumer Price Index (CPI) in May grew 3.4% YoY vs. 4.4% the prior month, the lowest level since June 2021. The common Core rose by 5.2% YoY, vs. 5.7% in April, the weakest since March 2022. After the data release, expectations for further tightening of the Boc fell, as odds for a hike on July 12 rose to 50%, below the 70% at the beginning of the week.
The US economic agenda will feature the US Initial Jobless Claims for the last week and the release of the Gross Domestic Product (GDP) figures and Pending Home Sales.
The USD/CAD reacted upward on Powell’s remarks but failed to crack the 20-day Exponential Moving Average (EMA) at 1.3280, suggesting that sellers remain in charge, around the 1.3300/1.3280 area. The Relative Strength Index (RSI) points upward but has yet to cross the bullish territory, so the USD/CAD remains exposed to selling pressure. Meanwhile, the three-day Rate of Change (RoC) suggests buyers are entering the market but not as strong as expected.
The USD/CAD would shift to neutral bullish if buyers reclaim the February 2 daily low of 1.3260 and extend its gains past 1.3300. Otherwise, any rallies could be used for USD/CAD sellers to reposition and enter at a better price.
Technical Levels: Supports and Resistances
USDCAD currently trading at 1.3242 at the time of writing. Pair opened at 1.3192 and is trading with a change of 0.38 % .
| Overview | Overview.1 | |
|---|---|---|
| 0 | Today last price | 1.3242 |
| 1 | Today Daily Change | 0.0050 |
| 2 | Today Daily Change % | 0.3800 |
| 3 | Today daily open | 1.3192 |
The pair remains strongly bearish on the daily time frame. It trades below the 20 SMA @ 1.3304, 50 SMA 1.3437, 100 SMA @ 1.35 and 200 SMA @ 1.3518.
| Trends | Trends.1 | |
|---|---|---|
| 0 | Daily SMA20 | 1.3304 |
| 1 | Daily SMA50 | 1.3437 |
| 2 | Daily SMA100 | 1.3500 |
| 3 | Daily SMA200 | 1.3518 |
The previous day high was 1.3192 while the previous day low was 1.3117. The daily 38.2% Fib levels comes at 1.3163, expected to provide support. Similarly, the daily 61.8% fib level is at 1.3146, expected to provide support.
Note the levels of interest below:
- Pivot support is noted at 1.3142, 1.3091, 1.3066
- Pivot resistance is noted at 1.3217, 1.3243, 1.3293
| Levels | Levels.1 |
|---|---|
| Previous Daily High | 1.3192 |
| Previous Daily Low | 1.3117 |
| Previous Weekly High | 1.3270 |
| Previous Weekly Low | 1.3139 |
| Previous Monthly High | 1.3655 |
| Previous Monthly Low | 1.3315 |
| Daily Fibonacci 38.2% | 1.3163 |
| Daily Fibonacci 61.8% | 1.3146 |
| Daily Pivot Point S1 | 1.3142 |
| Daily Pivot Point S2 | 1.3091 |
| Daily Pivot Point S3 | 1.3066 |
| Daily Pivot Point R1 | 1.3217 |
| Daily Pivot Point R2 | 1.3243 |
| Daily Pivot Point R3 | 1.3293 |
[/s2If]
Nehcap Expert Advisor
The NEHCAP MT4 EA is high quality professional trading system geared to generate returns without using GRID or martingales. Each trade has strict risk per trade parameter. The pairs under management include EURUSD, GBPUSD, AUDCAD, AUDNZD,GBPAUD, EURAUD, EURCAD, CHFJPY and many more.
The system is trading live: LIVE ACCOUNT TRACKING
You can run it free. Apply for a free trial and track our account. Buy the system or use profit share mechanism to generate returns on your MT4.
Join Our Telegram Group
")


